Your graphics add a nice touch to my presentations and I recently used them for one of my all-hands meetings. Your toolbox adds professionalism to my slides. Instead of using standard clipart.
Claude Jones, Director of Engineer, @Walmartlabs, USA
Your graphics add a nice touch to my presentations and I recently used them for one of my all-hands meetings. Your toolbox adds professionalism to my slides. Instead of using standard clipart.
Claude Jones, Director of Engineer, @Walmartlabs, USA
I needed a fresh look at some of my slides. I've tried to find a way to create a paintbrush effect, to underline, accentuate, add some color and the handwritten markers were just the things. Very easy to use, easy to size, change the color. It was an affordable, perfect solution and I'm happy to recommend it.
Anonymous, US
The crisp, clean look of the graphics, and the fact that it allowed me to easily edit and change the colors to match the template was my main reason for purchasing them.
Brandie Jenkins, E-learning Developer, USA
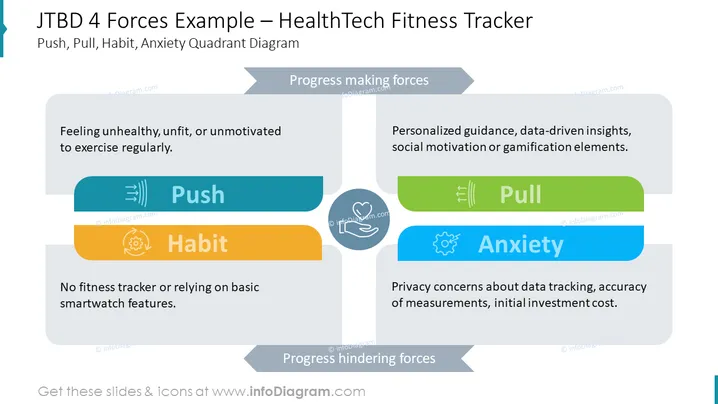
The slide shows a JTBD (Jobs to be Done) 4 Forces model for a HealthTech Fitness Tracker using a Push, Pull, Habit, and Anxiety Quadrant Diagram. The "Push" force refers to the feeling of being unhealthy, unfit, or unmotivated to exercise regularly; it's the pain point driving the need for change. "Habit" indicates the absence of a fitness tracker or reliance on basic smartwatch features, which suggests a behavior pattern in place. On the "Progress making forces" side, "Pull" represents the attractions of personalized guidance, data-driven insights, social motivation, or gamification elements that draw customers in. Lastly, "Anxiety" involves concerns about data privacy, accuracy of measurements, and the cost of investment, which can prevent customers from adopting the technology.
The overall look of the slide is clean, professional, and visually engaging with a color-coded diagram that clearly delineates the - The slide could be used in product development meetings to analyze consumer behavior and factors affecting product adoption.


