Your graphics add a nice touch to my presentations and I recently used them for one of my all-hands meetings. Your toolbox adds professionalism to my slides. Instead of using standard clipart.
Claude Jones, Director of Engineer, @Walmartlabs, USA
Before and after
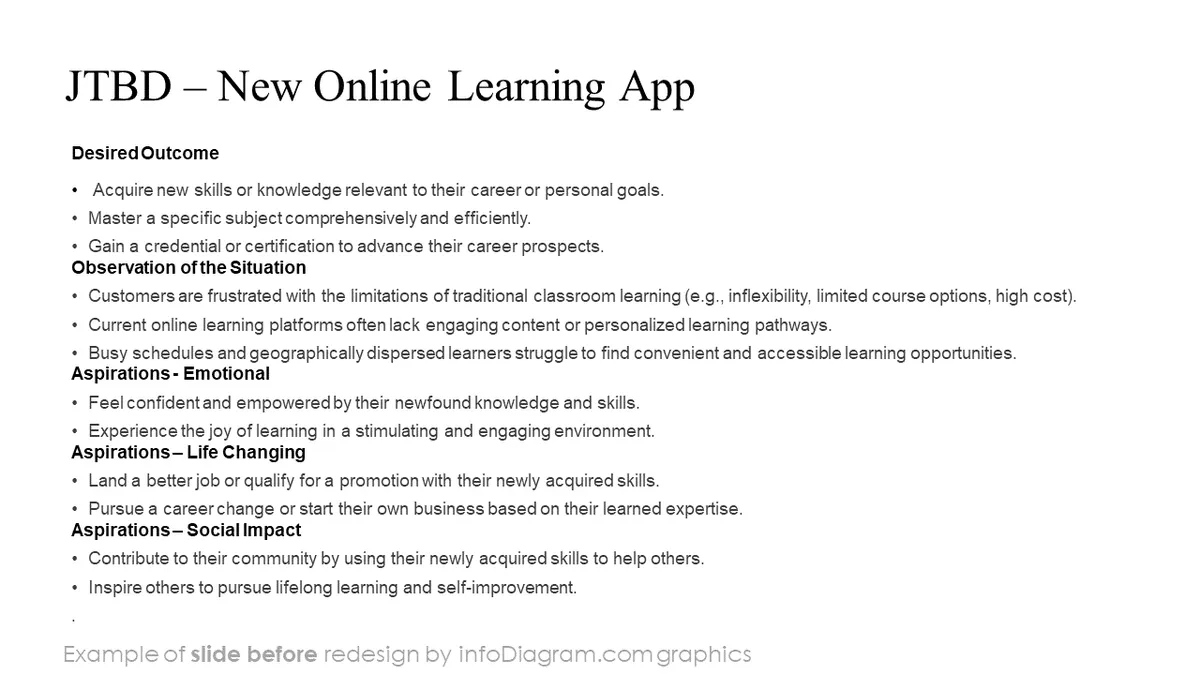
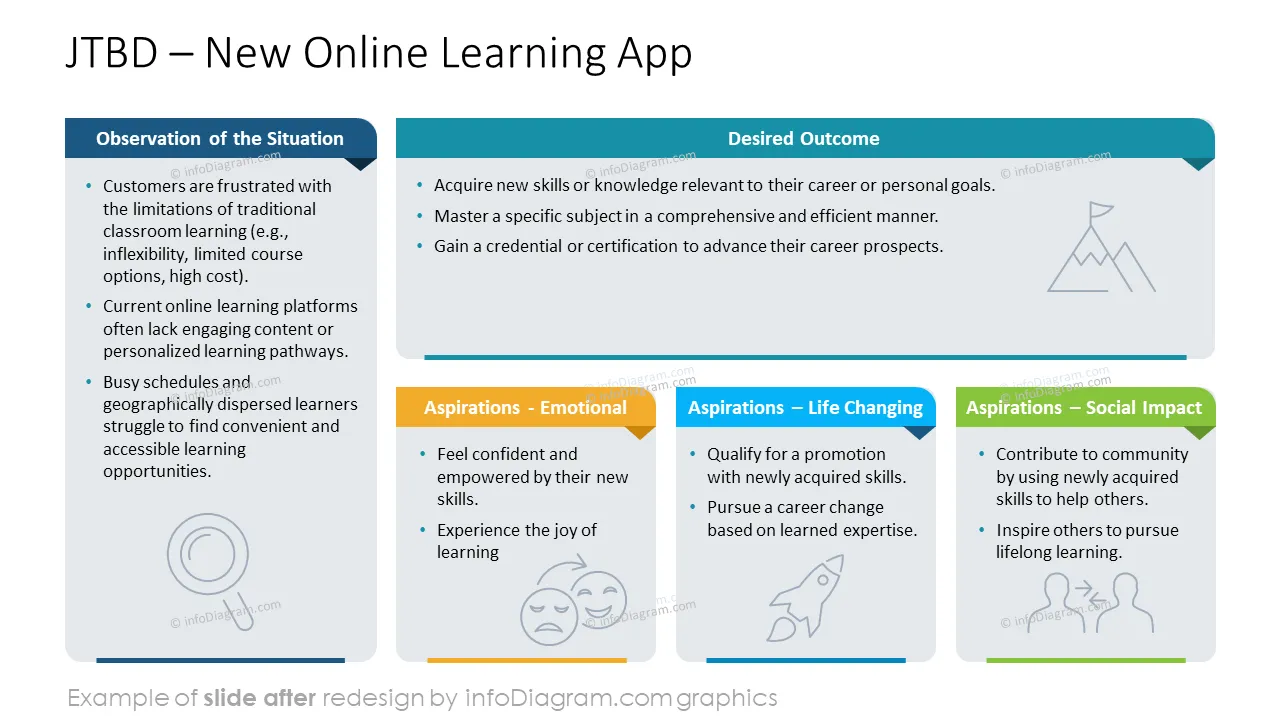
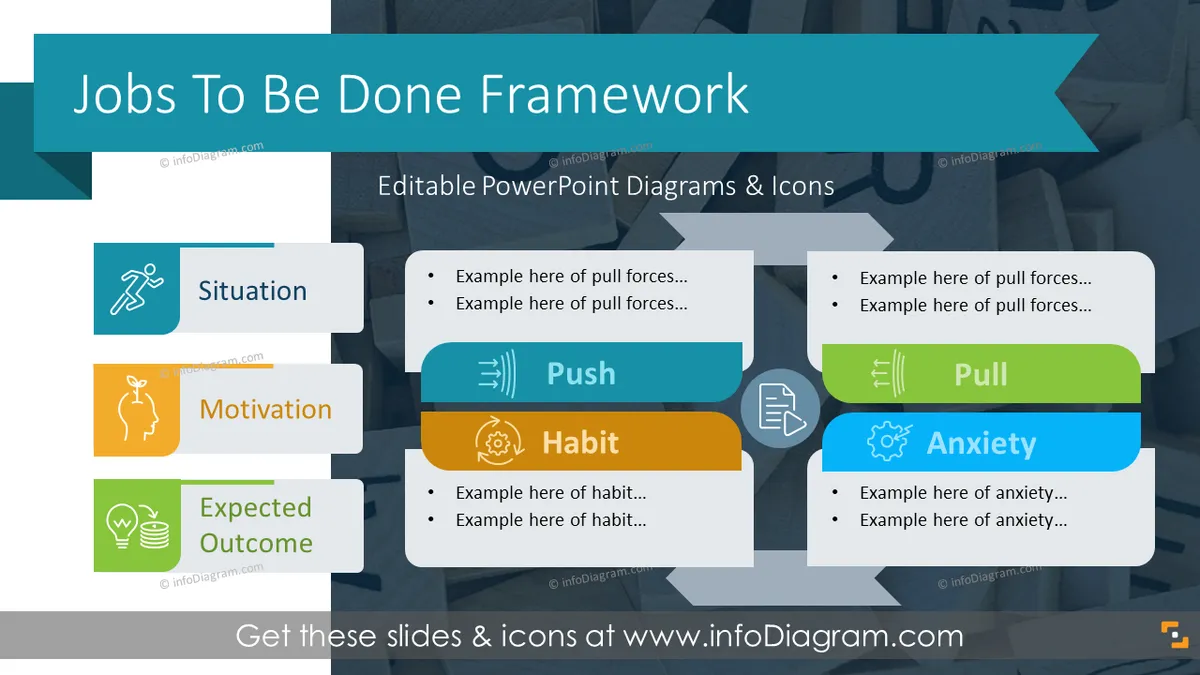
Want to present the essence of JTDB framework? Consider using visual way of illustrating Jobs-to-be-done concepts. We have designed a graphical diagram set to help you present this JTDB approach to your peers.
This PowerPoint slide deck is designed in an elegant, flat style with colorful vector illustrations and outline icons. All graphic shapes can be recolored and resized without quality loss.
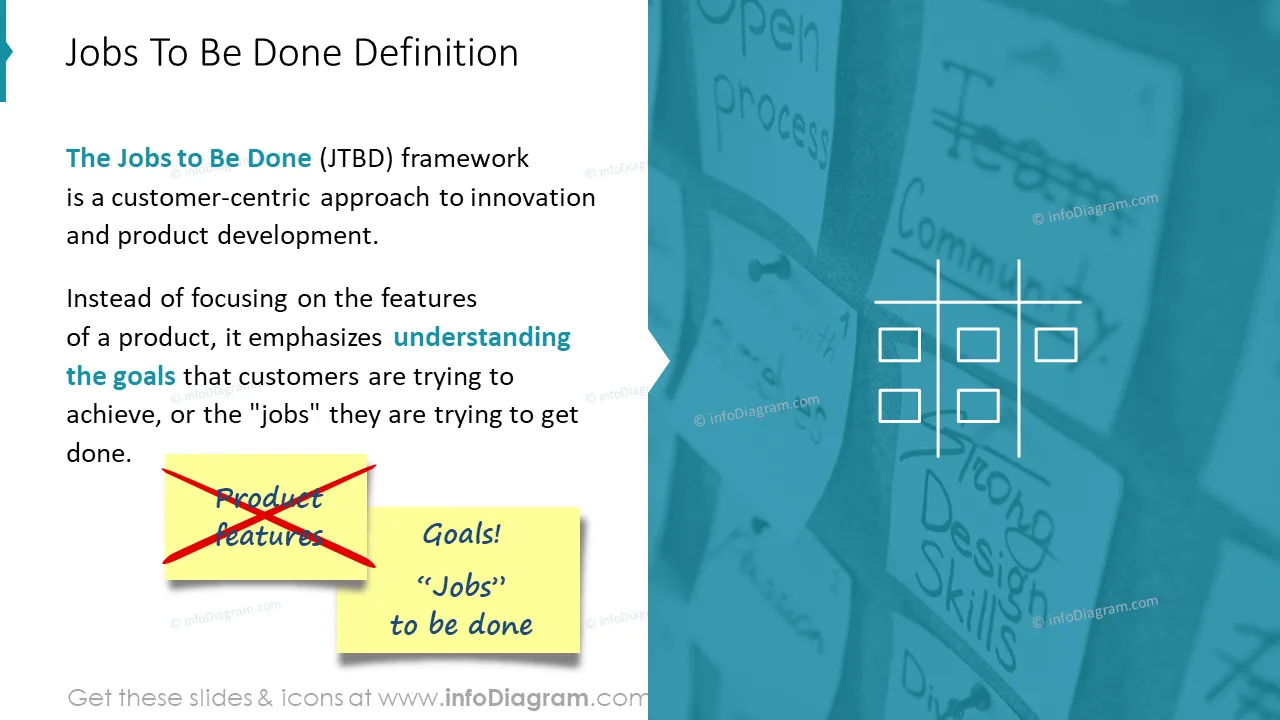
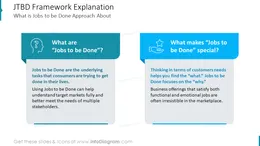
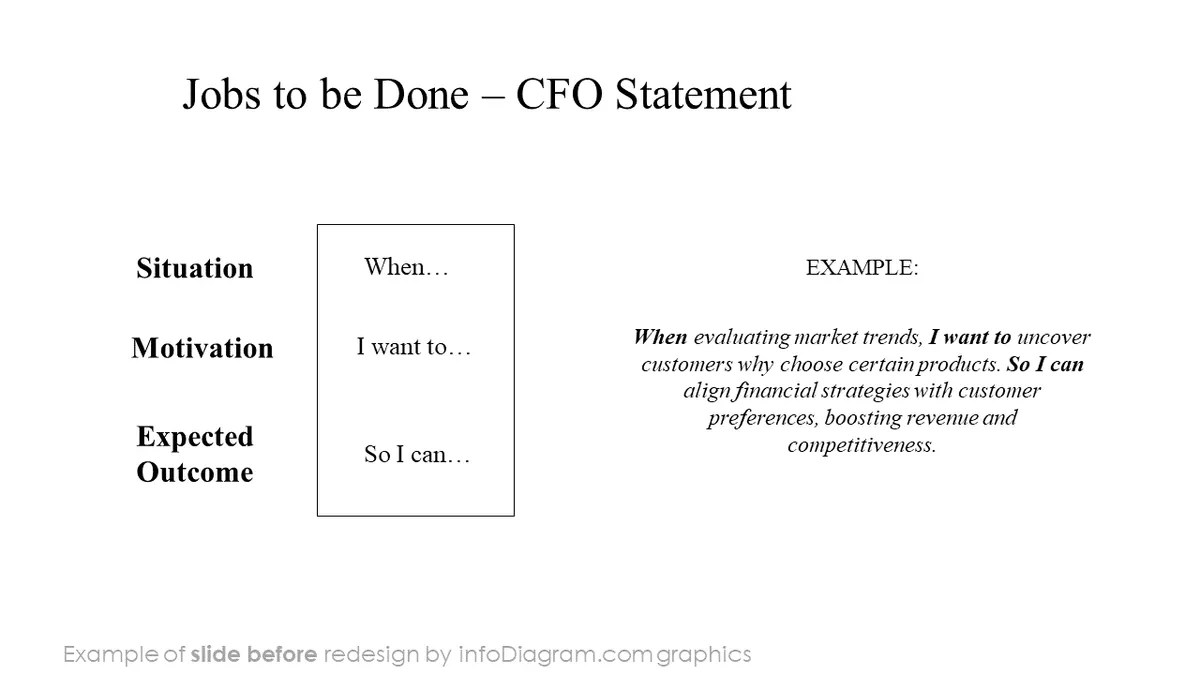
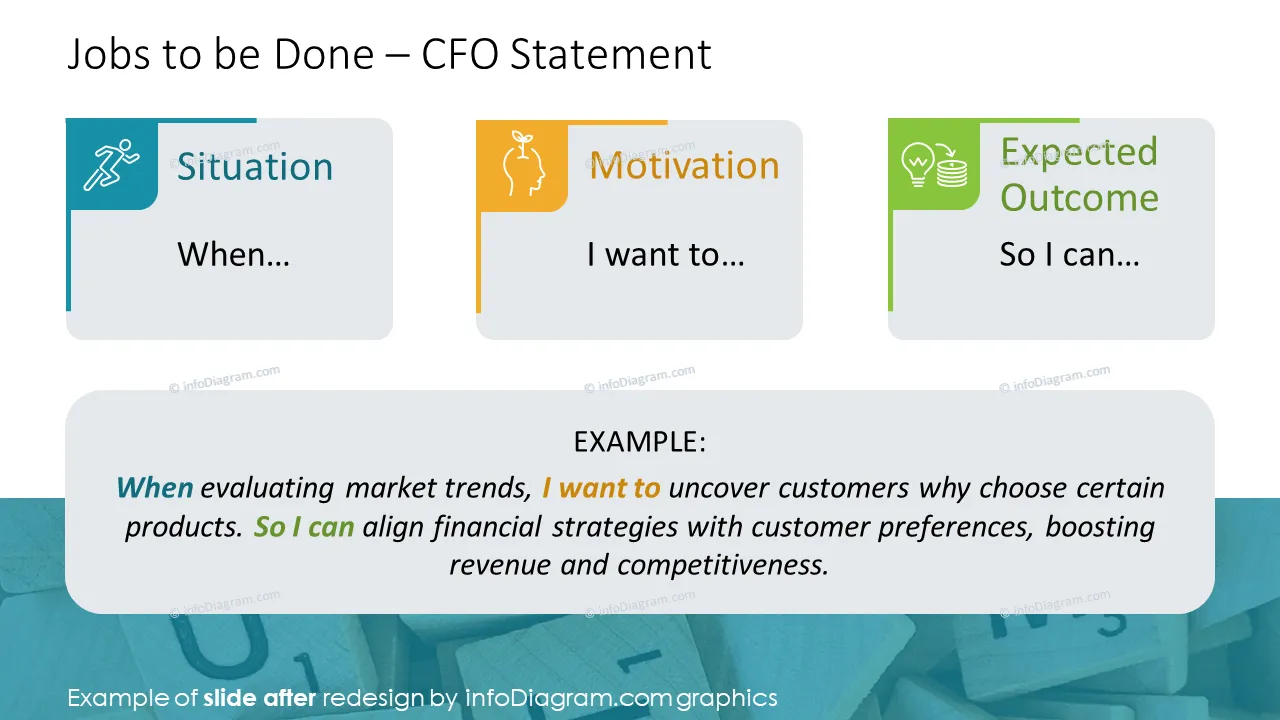
The Jobs to Be Done (JTBD) framework is a customer-centric approach to innovation and product development. Instead of focusing on a product's features, it emphasizes understanding the goals that customers are trying to achieve or the "jobs" they are trying to get done.
Jobs in JTDB are the underlying tasks consumers are trying to accomplish in their lives. Using Jobs to be Done can help understand target markets fully and better meet the needs of multiple stakeholders. Thinking in terms of customer needs helps you find the “what.” Jobs to be Done focuses on the “why”. Business offerings that satisfy both functional and emotional jobs are often irresistible in the marketplace.
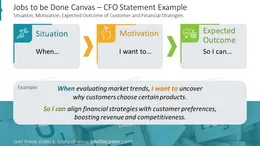
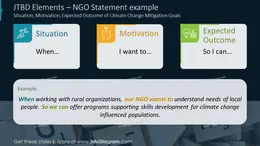
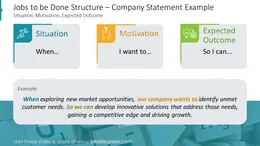
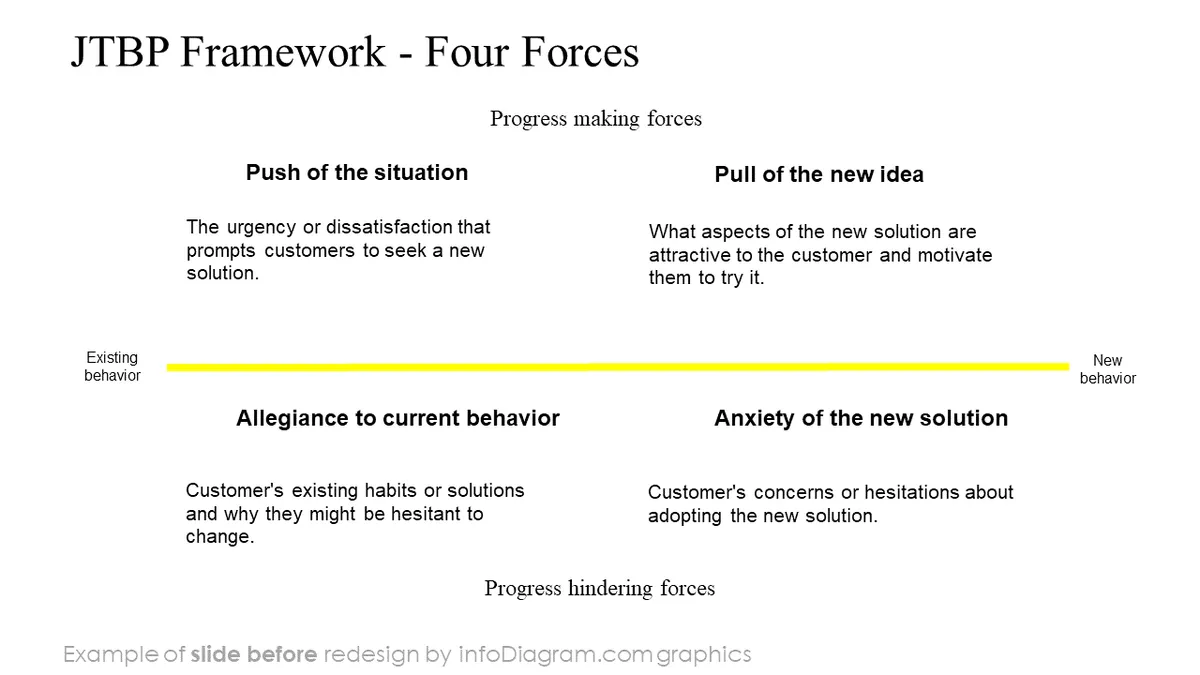
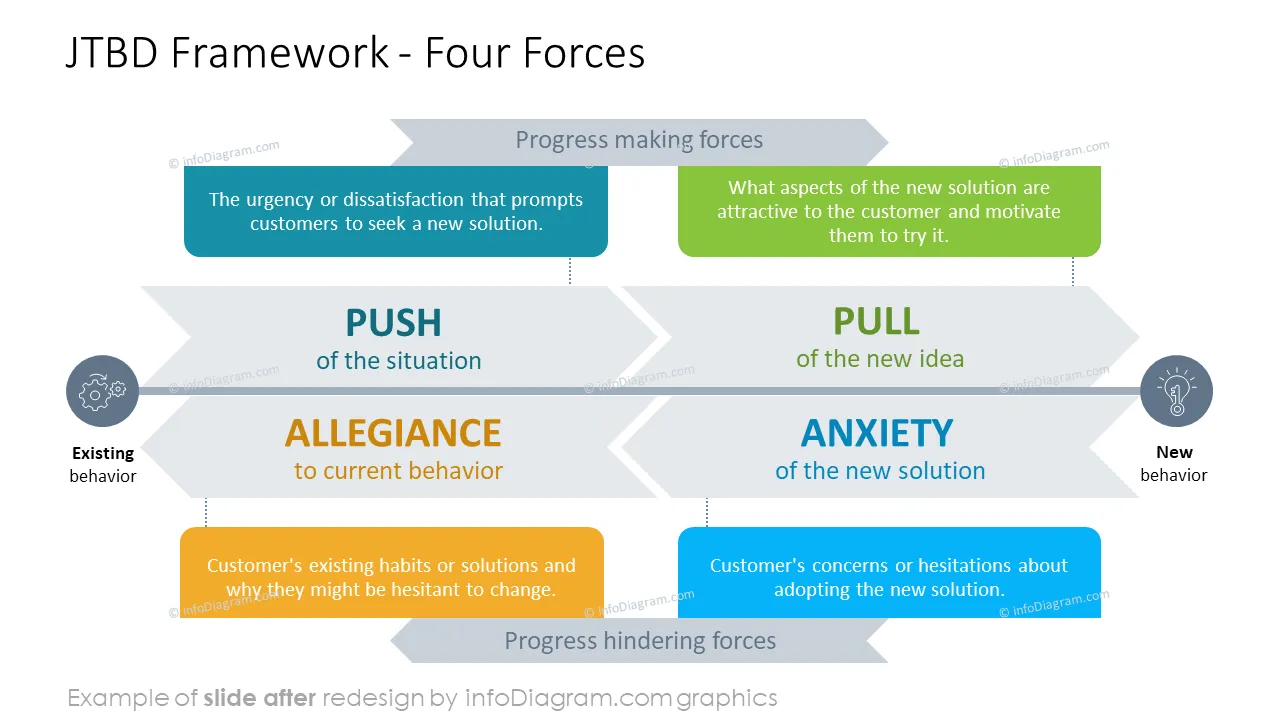
Using visual aids makes presenting concepts of JTDB more impactful. For example, you can use simple PowerPoint infographics to show four elements of JTDB or steps of the JTBD framework. Illustrating JTDB forces and structures makes it easy to understand and remember this framework. And your presentation will stand out.
You can use the JTDB visual template in various business cases. For example:
Try using those PowerPoint graphics to present your data visually in an elegant way.
All graphics are editable to modify the size, colors, and text. Also, you can extend the collection further with more PPT symbols (see Related Diagrams section).
Try using thisset of fully editable PowerPoint vector shapes to present your data visually in an elegant way. You can easily modify all elements:
Your graphics add a nice touch to my presentations and I recently used them for one of my all-hands meetings. Your toolbox adds professionalism to my slides. Instead of using standard clipart.
Claude Jones, Director of Engineer, @Walmartlabs, USA
I needed a fresh look at some of my slides. I've tried to find a way to create a paintbrush effect, to underline, accentuate, add some color and the handwritten markers were just the things. Very easy to use, easy to size, change the color. It was an affordable, perfect solution and I'm happy to recommend it.
Anonymous, US
The crisp, clean look of the graphics, and the fact that it allowed me to easily edit and change the colors to match the template was my main reason for purchasing them.
Brandie Jenkins, E-learning Developer, USA


You may also need