Your graphics add a nice touch to my presentations and I recently used them for one of my all-hands meetings. Your toolbox adds professionalism to my slides. Instead of using standard clipart.
Claude Jones, Director of Engineer, @Walmartlabs, USA
Your graphics add a nice touch to my presentations and I recently used them for one of my all-hands meetings. Your toolbox adds professionalism to my slides. Instead of using standard clipart.
Claude Jones, Director of Engineer, @Walmartlabs, USA
I needed a fresh look at some of my slides. I've tried to find a way to create a paintbrush effect, to underline, accentuate, add some color and the handwritten markers were just the things. Very easy to use, easy to size, change the color. It was an affordable, perfect solution and I'm happy to recommend it.
Anonymous, US
The crisp, clean look of the graphics, and the fact that it allowed me to easily edit and change the colors to match the template was my main reason for purchasing them.
Brandie Jenkins, E-learning Developer, USA
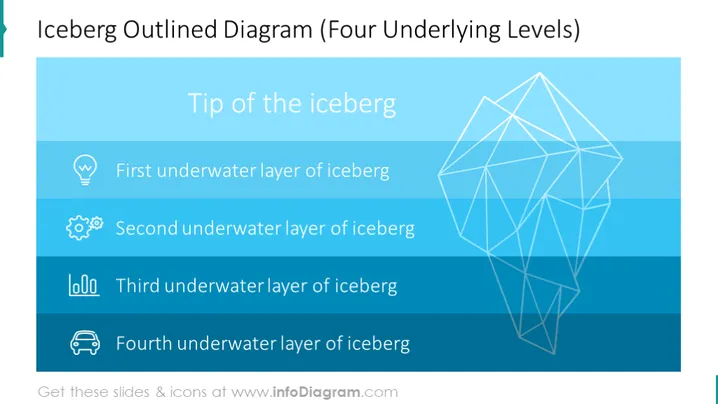
This slide presents an "Iceberg Outlined Diagram" with four underlying levels, which are used metaphorically to describe layers of complexity in an issue or system. The "Tip of the iceberg" denotes the visible, often superficial, aspect. The "First underwater layer of the iceberg" represents the initial, yet not apparent, factors. The "Second underwater layer of the iceberg" suggests more profound influences or issues. The "Third underwater layer of the iceberg" delves deeper into the underlying causes, and the "Fourth underwater layer of the iceberg" likely signifies the core principles or foundational elements that are the least visible.
The visual composition of the slide is simple yet striking, with a clean, modern design. The wireframe iceberg and icons against the blue gradient effectively convey depth and layers, making the concept instantly understandable.


