Your graphics add a nice touch to my presentations and I recently used them for one of my all-hands meetings. Your toolbox adds professionalism to my slides. Instead of using standard clipart.
Claude Jones, Director of Engineer, @Walmartlabs, USA
Your graphics add a nice touch to my presentations and I recently used them for one of my all-hands meetings. Your toolbox adds professionalism to my slides. Instead of using standard clipart.
Claude Jones, Director of Engineer, @Walmartlabs, USA
I needed a fresh look at some of my slides. I've tried to find a way to create a paintbrush effect, to underline, accentuate, add some color and the handwritten markers were just the things. Very easy to use, easy to size, change the color. It was an affordable, perfect solution and I'm happy to recommend it.
Anonymous, US
The crisp, clean look of the graphics, and the fact that it allowed me to easily edit and change the colors to match the template was my main reason for purchasing them.
Brandie Jenkins, E-learning Developer, USA
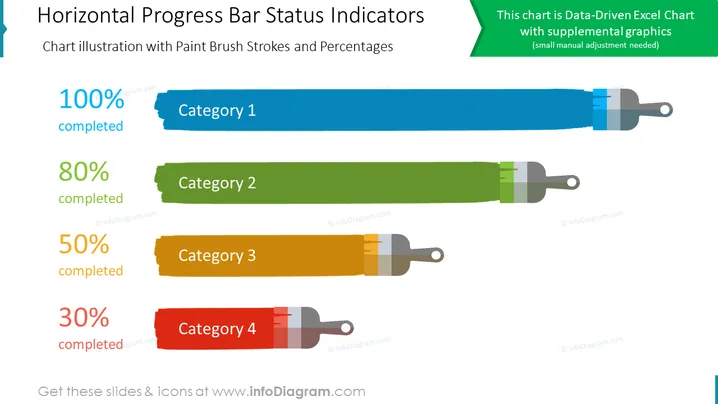
##Slide content: Present the progress visually with this paintbrush graphic slide. Show four categories or projects with the percentage of their completeness. Paint brush strokes will make your presentation more appealing and unique. You can edit the colors and elements to correspond with your company's needs; we included also detailed instructions on how to edit without losing the quality if you don't have designing skills. You can convert this PPT slide in other software, such as Google Slides and Keynote. Click on the picture to see the full Creative Comparison Bar Chart PowerPoint Template for more ideas.
##Slide infographic description: Data-Driven Excel Chart, Paint Brush Vector, Color Coding, White Background


