Your graphics add a nice touch to my presentations and I recently used them for one of my all-hands meetings. Your toolbox adds professionalism to my slides. Instead of using standard clipart.
Claude Jones, Director of Engineer, @Walmartlabs, USA
Your graphics add a nice touch to my presentations and I recently used them for one of my all-hands meetings. Your toolbox adds professionalism to my slides. Instead of using standard clipart.
Claude Jones, Director of Engineer, @Walmartlabs, USA
I needed a fresh look at some of my slides. I've tried to find a way to create a paintbrush effect, to underline, accentuate, add some color and the handwritten markers were just the things. Very easy to use, easy to size, change the color. It was an affordable, perfect solution and I'm happy to recommend it.
Anonymous, US
The crisp, clean look of the graphics, and the fact that it allowed me to easily edit and change the colors to match the template was my main reason for purchasing them.
Brandie Jenkins, E-learning Developer, USA
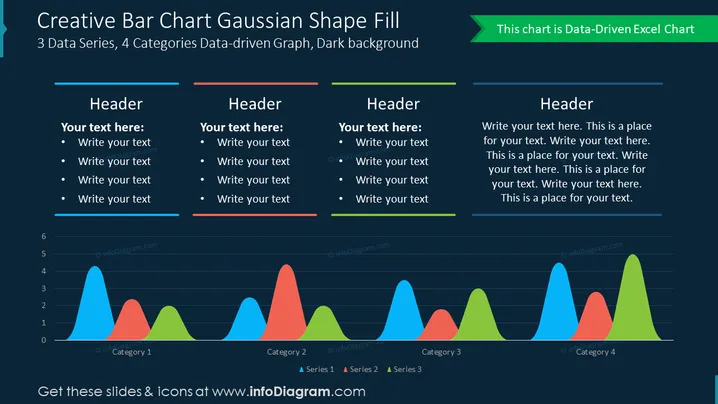
##Slide content: This infographic slide shows a gaussian graph chart with 3 data series and 4 categories of a data-driven graph. The dark background makes the elements even more visible and attention-grabbing. You can reuse this PPT template for several projects with small adjustments to the elements. We included detailed instructions on how to edit the graphics without any quality loss. You can download it from other software such as Google Slides and Keynote too. Click on the picture to see the whole Creative Comparisons and Shares Bar Charts presentation.
##Slide infographic description: Dark Background, Gaussian Chart, Line Vector, Bullet Points, Legend, Color Coding


