Your graphics add a nice touch to my presentations and I recently used them for one of my all-hands meetings. Your toolbox adds professionalism to my slides. Instead of using standard clipart.
Claude Jones, Director of Engineer, @Walmartlabs, USA
Your graphics add a nice touch to my presentations and I recently used them for one of my all-hands meetings. Your toolbox adds professionalism to my slides. Instead of using standard clipart.
Claude Jones, Director of Engineer, @Walmartlabs, USA
I needed a fresh look at some of my slides. I've tried to find a way to create a paintbrush effect, to underline, accentuate, add some color and the handwritten markers were just the things. Very easy to use, easy to size, change the color. It was an affordable, perfect solution and I'm happy to recommend it.
Anonymous, US
The crisp, clean look of the graphics, and the fact that it allowed me to easily edit and change the colors to match the template was my main reason for purchasing them.
Brandie Jenkins, E-learning Developer, USA
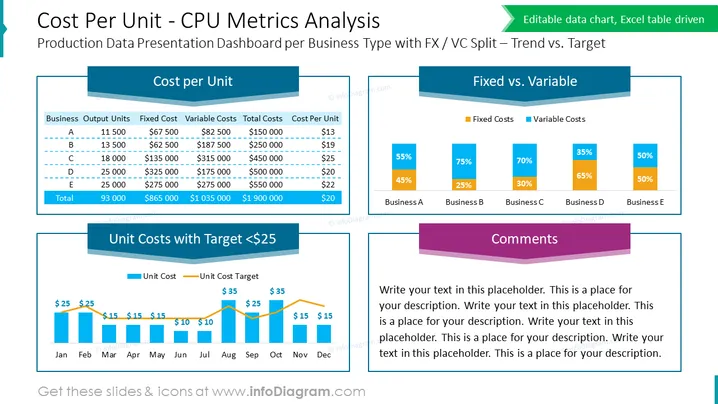
The slide titled "Cost Per Unit - CPU Metrics Analysis" focuses on a Production Data Presentation Dashboard for Business Type with FX / VC Split – Trend vs. Target. It breaks down various cost factors into three primary sections. The "Cost per Unit" section tabulates Business Output Units against Fixed, Variable, and Total Costs to calculate the Cost Per Unit. The "Fixed vs. Variable" section represents a graphical comparison of Fixed and Variable Costs across five business segments: A to E. Lastly, the "Unit Costs with Target <$25" section is a bar and line chart that tracks Unit Costs against a set Monthly Target, with a final "Comments" area for customizable text.
The slide looks professional and is designed for clear communication of complex cost analysis. The use of color-coding and graphical elements such as tables and charts facilitates easy interpretation of data.


