Your graphics add a nice touch to my presentations and I recently used them for one of my all-hands meetings. Your toolbox adds professionalism to my slides. Instead of using standard clipart.
Claude Jones, Director of Engineer, @Walmartlabs, USA
Your graphics add a nice touch to my presentations and I recently used them for one of my all-hands meetings. Your toolbox adds professionalism to my slides. Instead of using standard clipart.
Claude Jones, Director of Engineer, @Walmartlabs, USA
I needed a fresh look at some of my slides. I've tried to find a way to create a paintbrush effect, to underline, accentuate, add some color and the handwritten markers were just the things. Very easy to use, easy to size, change the color. It was an affordable, perfect solution and I'm happy to recommend it.
Anonymous, US
The crisp, clean look of the graphics, and the fact that it allowed me to easily edit and change the colors to match the template was my main reason for purchasing them.
Brandie Jenkins, E-learning Developer, USA
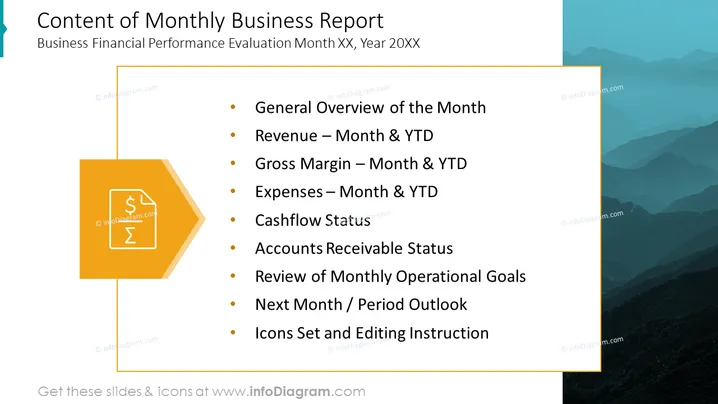
The slide outlines the key components of a Monthly Business Report, which includes an evaluation of financial performance. It starts with a "General Overview of the Month," providing a broad recap. "Revenue – Month & YTD" and "Gross Margin – Month & YTD" break down earnings and profitability to date, while "Expenses – Month & YTD" covers the costs incurred. "Cashflow Status" monitors the inflow and outflow of cash. "Accounts Receivable Status" examines outstanding customer payments. "Review of Monthly Operational Goals" evaluates progress towards objectives. "Next Month / Period Outlook" projects future business conditions, and "Icons Set and Editing Instruction" likely relates to the presentation's visual customization tools.
The slide has a professional and modern aesthetic with contrasting colors that draw attention to key elements. The use of a financial icon emphasizes the subject matter of the presentation.


