Your graphics add a nice touch to my presentations and I recently used them for one of my all-hands meetings. Your toolbox adds professionalism to my slides. Instead of using standard clipart.
Claude Jones, Director of Engineer, @Walmartlabs, USA
Your graphics add a nice touch to my presentations and I recently used them for one of my all-hands meetings. Your toolbox adds professionalism to my slides. Instead of using standard clipart.
Claude Jones, Director of Engineer, @Walmartlabs, USA
I needed a fresh look at some of my slides. I've tried to find a way to create a paintbrush effect, to underline, accentuate, add some color and the handwritten markers were just the things. Very easy to use, easy to size, change the color. It was an affordable, perfect solution and I'm happy to recommend it.
Anonymous, US
The crisp, clean look of the graphics, and the fact that it allowed me to easily edit and change the colors to match the template was my main reason for purchasing them.
Brandie Jenkins, E-learning Developer, USA
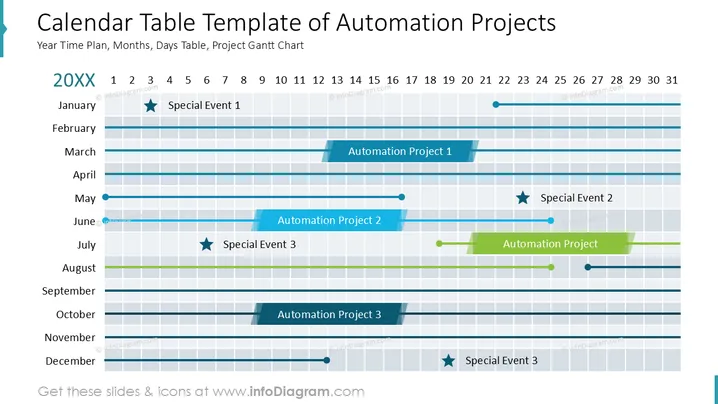
This slide illustrates a timeline for automation projects across the months of a year, with key events marked. "Special Event 1" represents a notable occurrence occurring in January. "Automation Project 1" spans from April to June, illustrating an ongoing task. "Automation Project 2" follows, running from June to August. A "Special Event 2" is set for July. Another task, "Automation Project," spreads through August. The slide also notes "Automation Project 3" for October, and a "Special Event 3" happening in July and December.
The slide is visually structured for easy reading, with clear color differentiation between elements and a grid layout that aligns timelines accurately.


