Your graphics add a nice touch to my presentations and I recently used them for one of my all-hands meetings. Your toolbox adds professionalism to my slides. Instead of using standard clipart.
Claude Jones, Director of Engineer, @Walmartlabs, USA
Your graphics add a nice touch to my presentations and I recently used them for one of my all-hands meetings. Your toolbox adds professionalism to my slides. Instead of using standard clipart.
Claude Jones, Director of Engineer, @Walmartlabs, USA
I needed a fresh look at some of my slides. I've tried to find a way to create a paintbrush effect, to underline, accentuate, add some color and the handwritten markers were just the things. Very easy to use, easy to size, change the color. It was an affordable, perfect solution and I'm happy to recommend it.
Anonymous, US
The crisp, clean look of the graphics, and the fact that it allowed me to easily edit and change the colors to match the template was my main reason for purchasing them.
Brandie Jenkins, E-learning Developer, USA
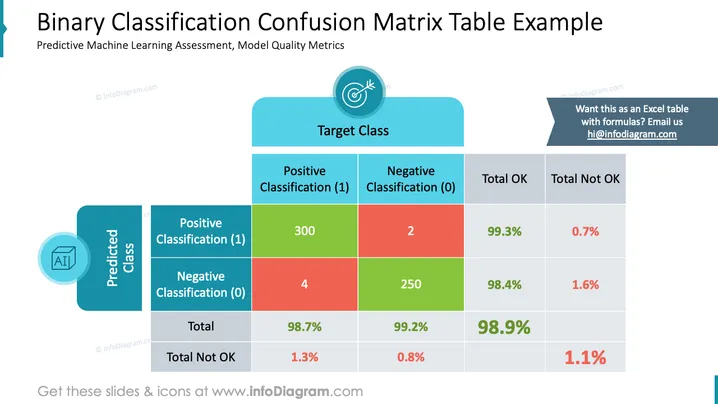
This PowerPoint slide presents a "Confusion Matrix Table" used for evaluating the performance of a binary classification algorithm, part of predictive machine learning model assessments. The matrix includes categories like True Positives (300 instances), True Negatives (250 instances), False Positives (2 instances), and False Negatives (4 instances), along with calculated percentages for each category indicating model accuracy, misclassification rate, and other quality metrics.
The slide is constructed with a professional and corporate style, using a color-coded matrix to denote different aspects of model validation. The design facilitates a clear understanding of the model's accuracy and error rates by visual separation and color distinction of different metrics.


