Your graphics add a nice touch to my presentations and I recently used them for one of my all-hands meetings. Your toolbox adds professionalism to my slides. Instead of using standard clipart.
Claude Jones, Director of Engineer, @Walmartlabs, USA
Your graphics add a nice touch to my presentations and I recently used them for one of my all-hands meetings. Your toolbox adds professionalism to my slides. Instead of using standard clipart.
Claude Jones, Director of Engineer, @Walmartlabs, USA
I needed a fresh look at some of my slides. I've tried to find a way to create a paintbrush effect, to underline, accentuate, add some color and the handwritten markers were just the things. Very easy to use, easy to size, change the color. It was an affordable, perfect solution and I'm happy to recommend it.
Anonymous, US
The crisp, clean look of the graphics, and the fact that it allowed me to easily edit and change the colors to match the template was my main reason for purchasing them.
Brandie Jenkins, E-learning Developer, USA
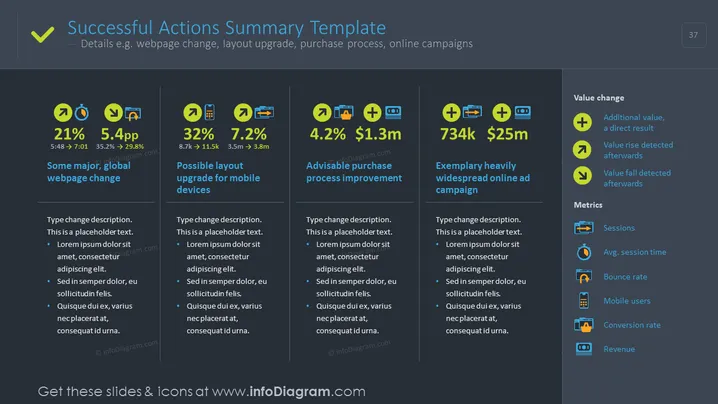
The slide titled "Successful Actions Summary Template" details key performance indicators (KPIs) for various business strategies, such as webpage changes, mobile layout upgrades, purchase process improvements, and online advertising campaigns. Each KPI is accompanied by a percentage or value change and further explained with sub-points. The KPIs include a 21% increase possibly due to a major, global webpage change, a 32% lift from a potential mobile layout upgrade, a 4.2% uptick suggesting advisable purchase process improvements, and a substantial gain characterized by 734k visits and $25m revenue from an exemplary online ad campaign.
The slide is visually balanced with a clear, coherent color scheme and icons aiding in topic identification. There is a structured flow with individual sections organized in a grid pattern for ease of comparison and reading.


