

Your graphics add a nice touch to my presentations and I recently used them for one of my all-hands meetings. Your toolbox adds professionalism to my slides. Instead of using standard clipart.
Claude Jones, Director of Engineer, @Walmartlabs, USA

Your graphics add a nice touch to my presentations and I recently used them for one of my all-hands meetings. Your toolbox adds professionalism to my slides. Instead of using standard clipart.
Claude Jones, Director of Engineer, @Walmartlabs, USA
I needed a fresh look at some of my slides. I've tried to find a way to create a paintbrush effect, to underline, accentuate, add some color and the handwritten markers were just the things. Very easy to use, easy to size, change the color. It was an affordable, perfect solution and I'm happy to recommend it.
Anonymous, US
The crisp, clean look of the graphics, and the fact that it allowed me to easily edit and change the colors to match the template was my main reason for purchasing them.
Brandie Jenkins, E-learning Developer, USA
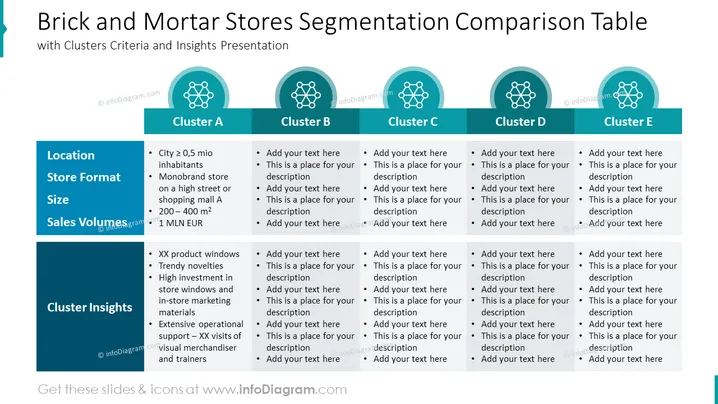
O slide apresenta uma tabela de comparação para segmentar lojas físicas em cinco grupos (A a E). Cada grupo tem critérios e insights fornecidos sob categorias como Localização, Formato da Loja, Tamanho, Volumes de Vendas e Insights do Grupo. O Grupo A é detalhado com exemplos como uma cidade com mais de quinhentos mil habitantes, uma loja monomarca em uma rua principal ou shopping, um tamanho entre 200-400 m², volumes de vendas acima de 1 milhão de EUR, e insights adicionais sobre exibições de produtos, novidades na moda, investimento em vitrines e materiais de marketing, assim como amplo suporte operacional.



