Your graphics add a nice touch to my presentations and I recently used them for one of my all-hands meetings. Your toolbox adds professionalism to my slides. Instead of using standard clipart.
Claude Jones, Director of Engineer, @Walmartlabs, USA
Your graphics add a nice touch to my presentations and I recently used them for one of my all-hands meetings. Your toolbox adds professionalism to my slides. Instead of using standard clipart.
Claude Jones, Director of Engineer, @Walmartlabs, USA
I needed a fresh look at some of my slides. I've tried to find a way to create a paintbrush effect, to underline, accentuate, add some color and the handwritten markers were just the things. Very easy to use, easy to size, change the color. It was an affordable, perfect solution and I'm happy to recommend it.
Anonymous, US
The crisp, clean look of the graphics, and the fact that it allowed me to easily edit and change the colors to match the template was my main reason for purchasing them.
Brandie Jenkins, E-learning Developer, USA
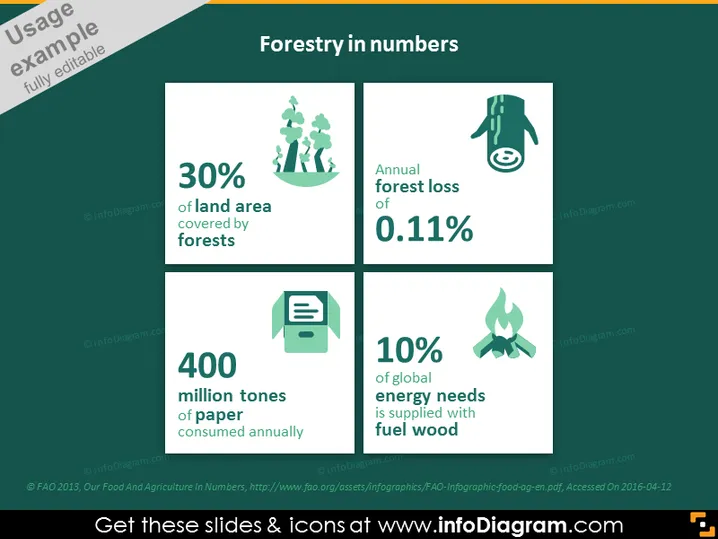
O slide apresenta estatísticas chave sobre silvicultura com foco em conservação e uso. Afirma que 30% da área terrestre é coberta por florestas, indicando uma medida da extensão global da silvicultura. Menciona uma perda florestal anual de 0,11%, destacando preocupações sobre as taxas de desmatamento. A estatística de 400 milhões de toneladas de papel consumido anualmente sugere um alto uso de papel e um potencial impacto ambiental. Por fim, aponta que 10% das necessidades energéticas globais são supridas com lenha, enfatizando a dependência das florestas para energia.


