

Your graphics add a nice touch to my presentations and I recently used them for one of my all-hands meetings. Your toolbox adds professionalism to my slides. Instead of using standard clipart.
Claude Jones, Director of Engineer, @Walmartlabs, USA

Your graphics add a nice touch to my presentations and I recently used them for one of my all-hands meetings. Your toolbox adds professionalism to my slides. Instead of using standard clipart.
Claude Jones, Director of Engineer, @Walmartlabs, USA
I needed a fresh look at some of my slides. I've tried to find a way to create a paintbrush effect, to underline, accentuate, add some color and the handwritten markers were just the things. Very easy to use, easy to size, change the color. It was an affordable, perfect solution and I'm happy to recommend it.
Anonymous, US
The crisp, clean look of the graphics, and the fact that it allowed me to easily edit and change the colors to match the template was my main reason for purchasing them.
Brandie Jenkins, E-learning Developer, USA
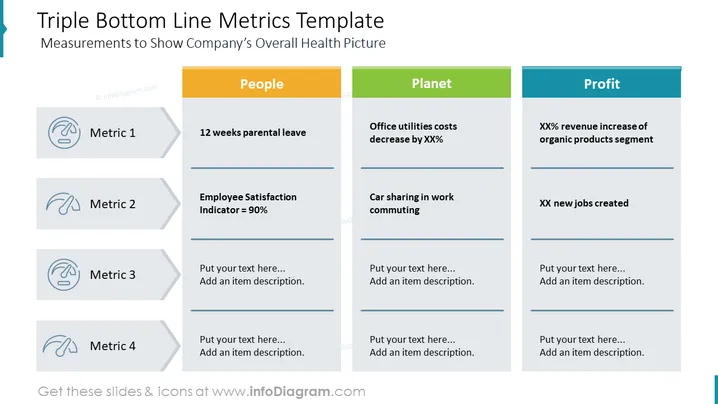
Esta tabela em PowerPoint fornece uma representação visual do conceito de Triplo Resultado (TBL), uma estrutura para medir o desempenho de uma empresa em termos de fatores sociais, ambientais e financeiros. O slide ilustra efetivamente a interconexão dessas três dimensões e destaca métricas-chave para cada área. Este slide em estilo infográfico pode ser usado em várias apresentações de negócios, particularmente aquelas focadas em sustentabilidade, responsabilidade social corporativa e desempenho geral dos negócios. Ele serve como uma ferramenta valiosa para comunicar o compromisso de uma empresa com práticas sustentáveis e seus esforços para equilibrar o lucro com responsabilidade social e ambiental.



