

Your graphics add a nice touch to my presentations and I recently used them for one of my all-hands meetings. Your toolbox adds professionalism to my slides. Instead of using standard clipart.
Claude Jones, Director of Engineer, @Walmartlabs, USA

Your graphics add a nice touch to my presentations and I recently used them for one of my all-hands meetings. Your toolbox adds professionalism to my slides. Instead of using standard clipart.
Claude Jones, Director of Engineer, @Walmartlabs, USA
I needed a fresh look at some of my slides. I've tried to find a way to create a paintbrush effect, to underline, accentuate, add some color and the handwritten markers were just the things. Very easy to use, easy to size, change the color. It was an affordable, perfect solution and I'm happy to recommend it.
Anonymous, US
The crisp, clean look of the graphics, and the fact that it allowed me to easily edit and change the colors to match the template was my main reason for purchasing them.
Brandie Jenkins, E-learning Developer, USA
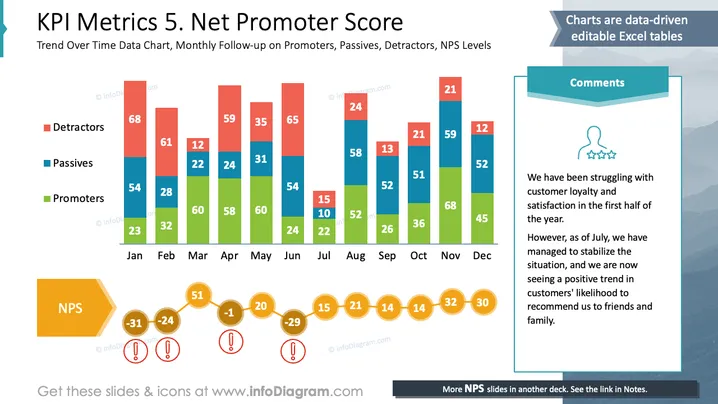
Este slide ilustra uma análise do Net Promoter Score (NPS) ao longo de um ano. Ele exibe tendências mensais para três grupos de clientes: Detratores criticam o serviço, impactando negativamente o NPS. Passivos são indiferentes, tendo pouco efeito no NPS. Promotores recomendam o serviço, aumentando o NPS. Comentários observam uma satisfação do cliente inicialmente baixa, que melhora a partir de julho, conforme mostrado pelo aumento dos Promotores e pela diminuição dos Detratores.
No geral, o slide combina efetivamente visualização de dados com elementos narrativos. As cores do gráfico contrastam bem, tornando diferentes categorias de dados facilmente distinguíveis.



