

Your graphics add a nice touch to my presentations and I recently used them for one of my all-hands meetings. Your toolbox adds professionalism to my slides. Instead of using standard clipart.
Claude Jones, Director of Engineer, @Walmartlabs, USA

Your graphics add a nice touch to my presentations and I recently used them for one of my all-hands meetings. Your toolbox adds professionalism to my slides. Instead of using standard clipart.
Claude Jones, Director of Engineer, @Walmartlabs, USA
I needed a fresh look at some of my slides. I've tried to find a way to create a paintbrush effect, to underline, accentuate, add some color and the handwritten markers were just the things. Very easy to use, easy to size, change the color. It was an affordable, perfect solution and I'm happy to recommend it.
Anonymous, US
The crisp, clean look of the graphics, and the fact that it allowed me to easily edit and change the colors to match the template was my main reason for purchasing them.
Brandie Jenkins, E-learning Developer, USA
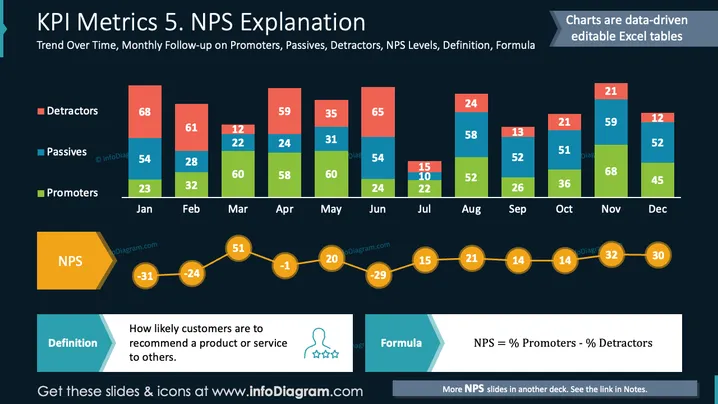
O slide fornece uma análise do Net Promoter Score (NPS) ao longo de um ano, seguindo promotores, passivos e detratores. "Promotores" (verde) são clientes entusiasmados, propensos a recomendar o produto, ajudando no crescimento. "Passivos" (azul) são clientes satisfeitos, mas não entusiasmados. "Detratores" (vermelho) são clientes insatisfeitos, propensos a impedir o crescimento. O NPS é calculado usando a fórmula: NPS = % Promotores - % Detratores. Os valores mensais do NPS representam tendências e insights sobre os níveis de satisfação do cliente.
O slide possui um layout visualmente atraente, utilizando cores contrastantes para clareza e ênfase nos principais pontos de dados e tendências.



