

Your graphics add a nice touch to my presentations and I recently used them for one of my all-hands meetings. Your toolbox adds professionalism to my slides. Instead of using standard clipart.
Claude Jones, Director of Engineer, @Walmartlabs, USA

Your graphics add a nice touch to my presentations and I recently used them for one of my all-hands meetings. Your toolbox adds professionalism to my slides. Instead of using standard clipart.
Claude Jones, Director of Engineer, @Walmartlabs, USA
I needed a fresh look at some of my slides. I've tried to find a way to create a paintbrush effect, to underline, accentuate, add some color and the handwritten markers were just the things. Very easy to use, easy to size, change the color. It was an affordable, perfect solution and I'm happy to recommend it.
Anonymous, US
The crisp, clean look of the graphics, and the fact that it allowed me to easily edit and change the colors to match the template was my main reason for purchasing them.
Brandie Jenkins, E-learning Developer, USA
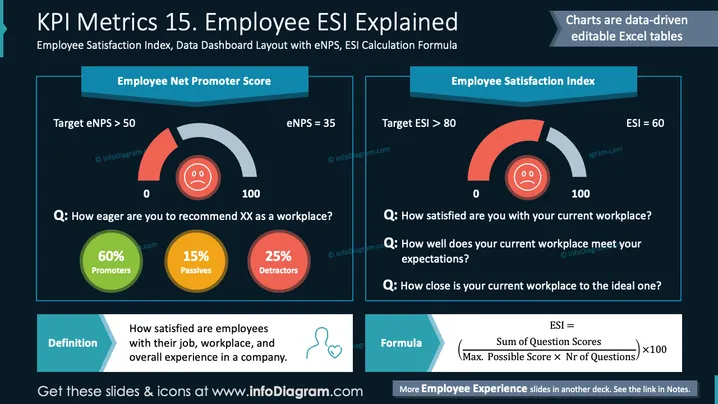
O slide trata da avaliação da satisfação dos funcionários por meio do Employee Net Promoter Score (eNPS) e do Employee Satisfaction Index (ESI). O eNPS é explicado usando um medidor que mede a disposição de recomendar o local de trabalho, com pontuações divididas em Promotores (60%), Passivos (15%) e Críticos (25%). O ESI mensura a satisfação geral, a adesão às expectativas e os ideais do local de trabalho, sugerindo que uma pontuação acima de 80 é ideal. O slide também fornece a fórmula de cálculo do ESI.
O slide é visualmente marcante com uma aparência profissional, utilizando simetria e cores bem escolhidas para enfatizar o conteúdo. Ícones e gráficos ajudam a simplificar métricas complexas.



