Your graphics add a nice touch to my presentations and I recently used them for one of my all-hands meetings. Your toolbox adds professionalism to my slides. Instead of using standard clipart.
Claude Jones, Director of Engineer, @Walmartlabs, USA
Your graphics add a nice touch to my presentations and I recently used them for one of my all-hands meetings. Your toolbox adds professionalism to my slides. Instead of using standard clipart.
Claude Jones, Director of Engineer, @Walmartlabs, USA
I needed a fresh look at some of my slides. I've tried to find a way to create a paintbrush effect, to underline, accentuate, add some color and the handwritten markers were just the things. Very easy to use, easy to size, change the color. It was an affordable, perfect solution and I'm happy to recommend it.
Anonymous, US
The crisp, clean look of the graphics, and the fact that it allowed me to easily edit and change the colors to match the template was my main reason for purchasing them.
Brandie Jenkins, E-learning Developer, USA
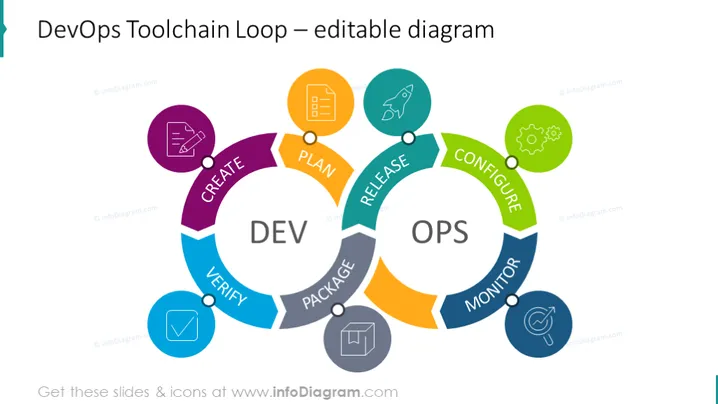
Este diagrama ilustrativo mostra a relação entre as etapas da metodologia DevOps, como planejar, criar, verificar, empacotar, liberar, configurar e monitorar. Discuta o fluxo de trabalho em loop que contém desenvolvimento e operações de TI com visuais explicativos e cative a atenção do seu público. Saiba mais sobre DevOps na Wikipedia.
Este Diagrama de Loop da Ferramenta DevOps Editável é parte de nosso Template de PPT do Diagrama de Loop da Ferramenta DevOps.


