Your graphics add a nice touch to my presentations and I recently used them for one of my all-hands meetings. Your toolbox adds professionalism to my slides. Instead of using standard clipart.
Claude Jones, Director of Engineer, @Walmartlabs, USA
Your graphics add a nice touch to my presentations and I recently used them for one of my all-hands meetings. Your toolbox adds professionalism to my slides. Instead of using standard clipart.
Claude Jones, Director of Engineer, @Walmartlabs, USA
I needed a fresh look at some of my slides. I've tried to find a way to create a paintbrush effect, to underline, accentuate, add some color and the handwritten markers were just the things. Very easy to use, easy to size, change the color. It was an affordable, perfect solution and I'm happy to recommend it.
Anonymous, US
The crisp, clean look of the graphics, and the fact that it allowed me to easily edit and change the colors to match the template was my main reason for purchasing them.
Brandie Jenkins, E-learning Developer, USA
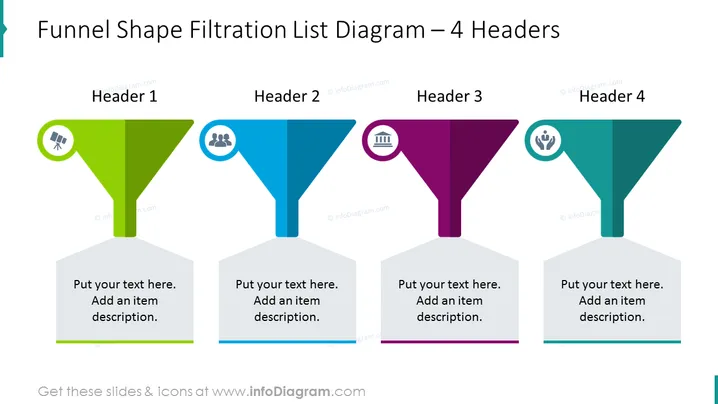
O slide retrata um diagrama de lista em forma de funil com quatro estágios, representados como cabeçalhos distintos. Cada cabeçalho é codificado por cores e inclui um ícone no topo do funil que corresponde ao tema do estágio. "Cabeçalho 1" em verde sinaliza a fase inicial e sugere um processo analítico com seu ícone de gráfico de barras. "Cabeçalho 2" está em azul, indicando o segundo estágio com um ícone de grupo de pessoas, possivelmente denotando um aspecto colaborativo ou demográfico. A seguir, "Cabeçalho 3" em roxo tem um ícone de edifícios simbolizando um nível organizacional ou estrutural. Finalmente, "Cabeçalho 4" em azul-petróleo tem um ícone representando liderança ou trabalho em equipe. Cada funil está conectado a uma caixa de texto para elaborar sobre o item ou estágio específico.


