

Your graphics add a nice touch to my presentations and I recently used them for one of my all-hands meetings. Your toolbox adds professionalism to my slides. Instead of using standard clipart.
Claude Jones, Director of Engineer, @Walmartlabs, USA

Your graphics add a nice touch to my presentations and I recently used them for one of my all-hands meetings. Your toolbox adds professionalism to my slides. Instead of using standard clipart.
Claude Jones, Director of Engineer, @Walmartlabs, USA
I needed a fresh look at some of my slides. I've tried to find a way to create a paintbrush effect, to underline, accentuate, add some color and the handwritten markers were just the things. Very easy to use, easy to size, change the color. It was an affordable, perfect solution and I'm happy to recommend it.
Anonymous, US
The crisp, clean look of the graphics, and the fact that it allowed me to easily edit and change the colors to match the template was my main reason for purchasing them.
Brandie Jenkins, E-learning Developer, USA
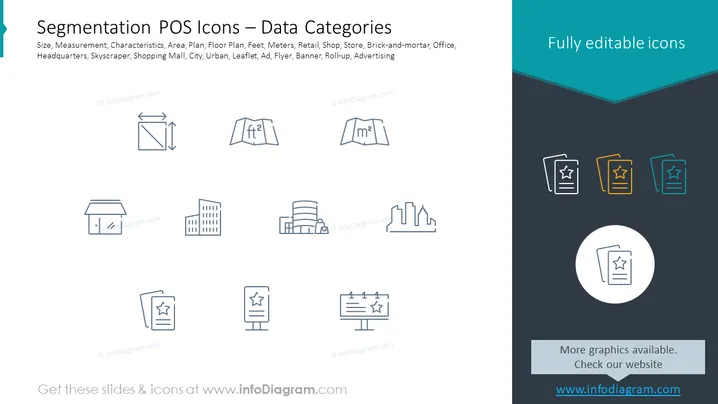
O slide apresenta um conjunto de ícones representando várias categorias de dados relacionadas à 'Segmentação POS'. Lista categorias como Tamanho, Medida, Área, Varejo e Publicidade, cada uma exemplificada por um ícone. 'Tamanho' e 'Medida' têm ícones que se assemelham a ferramentas de medição, sugerindo dimensões. 'Área' exibe um marcador de mapa, indicando localização. 'Varejo' possui um ícone de vitrine, simbolizando lojas físicas, enquanto 'Escritório' e 'Arranha-céu' representam diferentes tipos de edifícios. 'Cidade' e 'Urbano' mostram paisagens urbanas. 'Folheto', 'Anúncio', 'Panfleto', 'Banner' e 'Roll-up' são representados com vários materiais publicitários, insinuando estratégias de marketing.



