
Your graphics add a nice touch to my presentations and I recently used them for one of my all-hands meetings. Your toolbox adds professionalism to my slides. Instead of using standard clipart.
Claude Jones, Director of Engineer, @Walmartlabs, USA

Your graphics add a nice touch to my presentations and I recently used them for one of my all-hands meetings. Your toolbox adds professionalism to my slides. Instead of using standard clipart.
Claude Jones, Director of Engineer, @Walmartlabs, USA

I needed a fresh look at some of my slides. I've tried to find a way to create a paintbrush effect, to underline, accentuate, add some color and the handwritten markers were just the things. Very easy to use, easy to size, change the color. It was an affordable, perfect solution and I'm happy to recommend it.
Anonymous, US
The crisp, clean look of the graphics, and the fact that it allowed me to easily edit and change the colors to match the template was my main reason for purchasing them.
Brandie Jenkins, E-learning Developer, USA
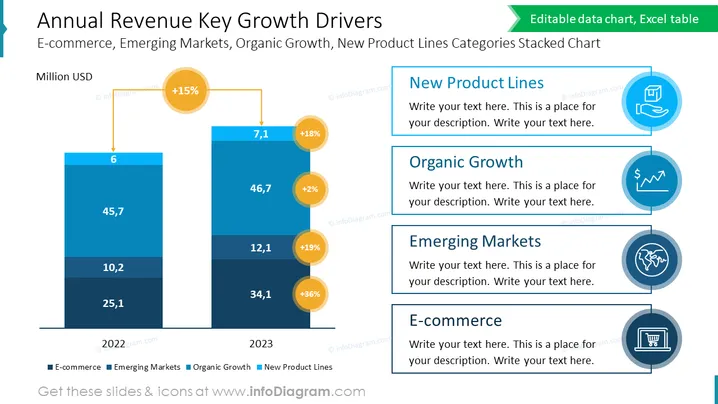
Este slide é uma ferramenta analítica em PowerPoint projetada para exibir os principais motores de crescimento da receita anual de uma empresa. Utiliza um gráfico de barras empilhadas e marcadores de aumento percentual para ilustrar as contribuições de diferentes setores, como e-commerce, mercados emergentes e novas linhas de produtos para o crescimento financeiro da empresa. Ideal para revisões estratégicas de negócios ou apresentações para investidores, este modelo de infográfico visualiza de forma sucinta dados complexos para uma comunicação clara.


