

Your graphics add a nice touch to my presentations and I recently used them for one of my all-hands meetings. Your toolbox adds professionalism to my slides. Instead of using standard clipart.
Claude Jones, Director of Engineer, @Walmartlabs, USA

Your graphics add a nice touch to my presentations and I recently used them for one of my all-hands meetings. Your toolbox adds professionalism to my slides. Instead of using standard clipart.
Claude Jones, Director of Engineer, @Walmartlabs, USA
I needed a fresh look at some of my slides. I've tried to find a way to create a paintbrush effect, to underline, accentuate, add some color and the handwritten markers were just the things. Very easy to use, easy to size, change the color. It was an affordable, perfect solution and I'm happy to recommend it.
Anonymous, US
The crisp, clean look of the graphics, and the fact that it allowed me to easily edit and change the colors to match the template was my main reason for purchasing them.
Brandie Jenkins, E-learning Developer, USA
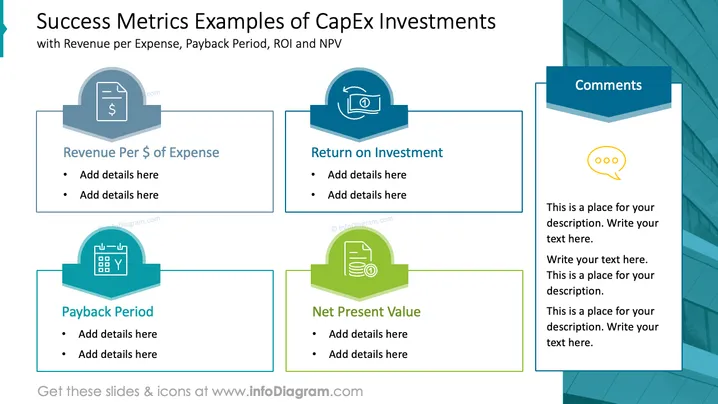
O slide é intitulado "Exemplos de Métricas de Sucesso de Investimentos de CapEx" e apresenta quatro conceitos financeiros distintos: Receita por Despesa, Retorno sobre o Investimento (ROI), Período de Recuperação (Payback Period) e Valor Presente Líquido (VPL). Cada conceito está associado a um ícone e dois pontos de destaque para detalhes adicionais. Receita por Despesa pode envolver a medição da eficiência dos gastos, ROI quantifica o ganho dos investimentos, Período de Recuperação calcula quanto tempo leva para recuperar um investimento, e VPL avalia a lucratividade de um projeto considerando o valor do dinheiro no tempo.
O slide possui um layout limpo e profissional com blocos de informação logicamente estruturados para fácil leitura. O uso de ícones correspondentes a cada conceito financeiro fornece dicas visuais para auxiliar na compreensão do espectador.



