
Your graphics add a nice touch to my presentations and I recently used them for one of my all-hands meetings. Your toolbox adds professionalism to my slides. Instead of using standard clipart.
Claude Jones, Director of Engineer, @Walmartlabs, USA

Your graphics add a nice touch to my presentations and I recently used them for one of my all-hands meetings. Your toolbox adds professionalism to my slides. Instead of using standard clipart.
Claude Jones, Director of Engineer, @Walmartlabs, USA
I needed a fresh look at some of my slides. I've tried to find a way to create a paintbrush effect, to underline, accentuate, add some color and the handwritten markers were just the things. Very easy to use, easy to size, change the color. It was an affordable, perfect solution and I'm happy to recommend it.
Anonymous, US
The crisp, clean look of the graphics, and the fact that it allowed me to easily edit and change the colors to match the template was my main reason for purchasing them.
Brandie Jenkins, E-learning Developer, USA
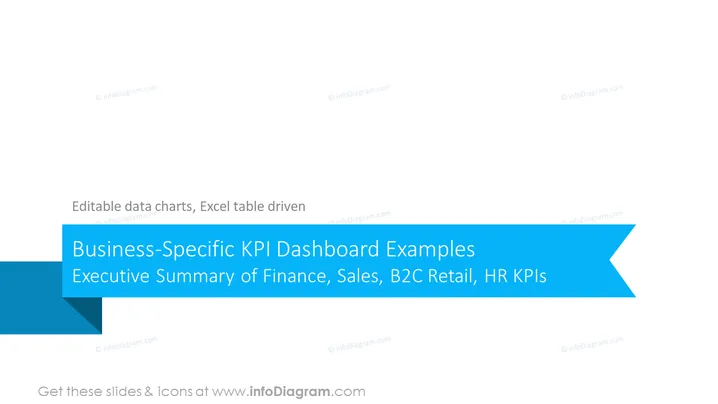
O slide apresenta uma visão geral de "Exemplos de Dashboard de KPI Específicos do Negócio" com um subtítulo que enfatiza que estes são gráficos de dados editáveis impulsionados por tabelas do Excel. O slide sugere a apresentação de exemplos de indicadores chave de desempenho (KPI) relacionados a áreas de negócios específicas, como Finanças, Vendas, Varejo B2C e Recursos Humanos. Cada área representa aspectos vitais das operações comerciais: Finanças abrange o desempenho monetário, Vendas refletem atividades geradoras de receita, Varejo B2C diz respeito a métricas de vendas diretas ao consumidor, e KPIs de RH medem a eficácia da gestão da força de trabalho.