
Your graphics add a nice touch to my presentations and I recently used them for one of my all-hands meetings. Your toolbox adds professionalism to my slides. Instead of using standard clipart.
Claude Jones, Director of Engineer, @Walmartlabs, USA
Your graphics add a nice touch to my presentations and I recently used them for one of my all-hands meetings. Your toolbox adds professionalism to my slides. Instead of using standard clipart.
Claude Jones, Director of Engineer, @Walmartlabs, USA
I needed a fresh look at some of my slides. I've tried to find a way to create a paintbrush effect, to underline, accentuate, add some color and the handwritten markers were just the things. Very easy to use, easy to size, change the color. It was an affordable, perfect solution and I'm happy to recommend it.
Anonymous, US
The crisp, clean look of the graphics, and the fact that it allowed me to easily edit and change the colors to match the template was my main reason for purchasing them.
Brandie Jenkins, E-learning Developer, USA
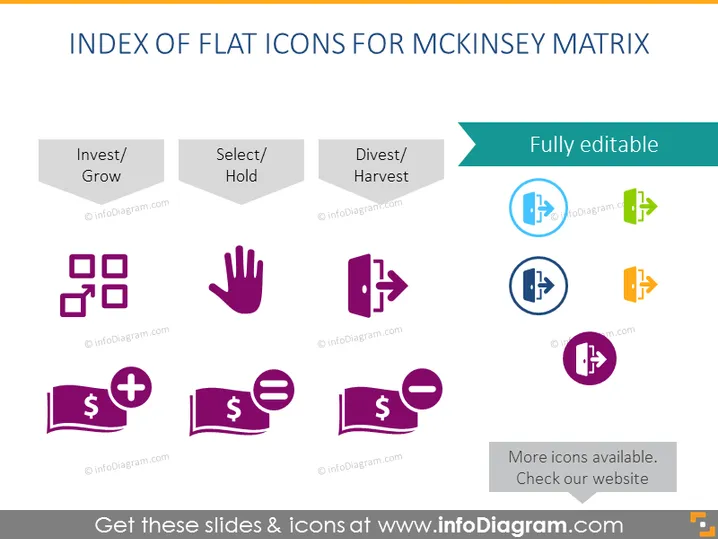
O slide do PowerPoint é intitulado "ÍNDICE DE ÍCONES PLANOS PARA A MATRIZ MCKINSEY," o que indica uma coleção de ícones que correlacionam com a estrutura da Matriz McKinsey para análise de negócios. O slide mostra três categorias de ações estratégicas: "Investir/Crescer," "Selecionar/Manter," e "Desinvestir/Colher." Sob "Investir/Crescer," ícones representam crescimento ou expansão, como aglomerados de quadrados sugerindo organização ou crescimento. "Selecionar/Manter" apresenta um ícone de mão, denotando seleção ou pausa, enquanto "Desinvestir/Colher" retrata uma porta semiaberta, conotando liberação ou corte. Outro conjunto de ícones agrupados abaixo representa ações financeiras com símbolos de moeda, sinais de adição e sinais de igual, enfatizando decisões monetárias ligadas às direções estratégicas.




