

Your graphics add a nice touch to my presentations and I recently used them for one of my all-hands meetings. Your toolbox adds professionalism to my slides. Instead of using standard clipart.
Claude Jones, Director of Engineer, @Walmartlabs, USA

Your graphics add a nice touch to my presentations and I recently used them for one of my all-hands meetings. Your toolbox adds professionalism to my slides. Instead of using standard clipart.
Claude Jones, Director of Engineer, @Walmartlabs, USA
I needed a fresh look at some of my slides. I've tried to find a way to create a paintbrush effect, to underline, accentuate, add some color and the handwritten markers were just the things. Very easy to use, easy to size, change the color. It was an affordable, perfect solution and I'm happy to recommend it.
Anonymous, US
The crisp, clean look of the graphics, and the fact that it allowed me to easily edit and change the colors to match the template was my main reason for purchasing them.
Brandie Jenkins, E-learning Developer, USA
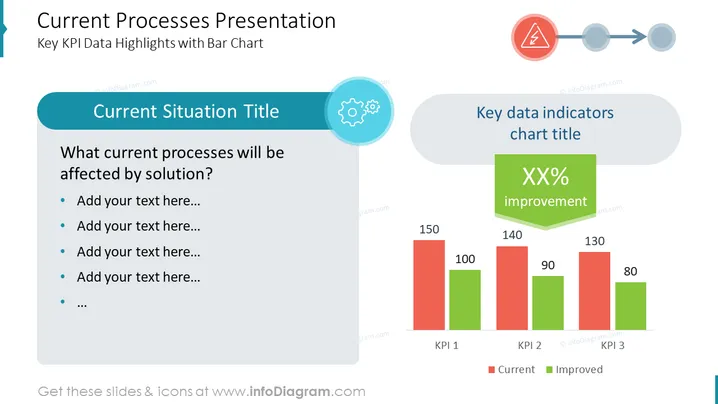
O slide intitulado "Apresentação dos Processos Atuais" apresenta "Principais Destaques de Dados KPI com Gráfico de Barras" sobre como certos processos serão impactados por uma solução. O lado esquerdo do slide contém uma seção rotulada "Título da Situação Atual" com pontos de bala onde o texto pode ser adicionado para descrever os processos que estarão sujeitos a mudanças. Adjacente a isso, do lado direito, há um gráfico de barras mostrando três indicadores-chave de desempenho (KPIs), comparando os valores "Atual" e "Aprimorado", enfatizando melhorias de desempenho.



