

Your graphics add a nice touch to my presentations and I recently used them for one of my all-hands meetings. Your toolbox adds professionalism to my slides. Instead of using standard clipart.
Claude Jones, Director of Engineer, @Walmartlabs, USA

Your graphics add a nice touch to my presentations and I recently used them for one of my all-hands meetings. Your toolbox adds professionalism to my slides. Instead of using standard clipart.
Claude Jones, Director of Engineer, @Walmartlabs, USA
I needed a fresh look at some of my slides. I've tried to find a way to create a paintbrush effect, to underline, accentuate, add some color and the handwritten markers were just the things. Very easy to use, easy to size, change the color. It was an affordable, perfect solution and I'm happy to recommend it.
Anonymous, US
The crisp, clean look of the graphics, and the fact that it allowed me to easily edit and change the colors to match the template was my main reason for purchasing them.
Brandie Jenkins, E-learning Developer, USA
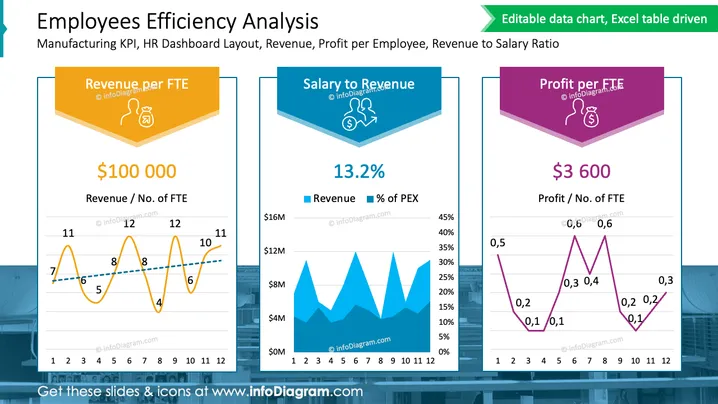
O slide apresenta um layout de painel focado na eficiência dos funcionários, especificamente direcionado a KPIs de manufatura. Há três métricas principais destacadas: Receita por FTE (Equivalente a Tempo Integral), com um valor de R$100.000; Relação Salário sobre Receita, em 13,2%; e Lucro por FTE, listado como R$3.600. Cada métrica é acompanhada por uma representação gráfica — um gráfico de linha para Receita por FTE, um gráfico de barras mostrando Receita versus Percentual de PEX (Despesas com Pessoal), e outro gráfico de linha para Lucro por FTE — representando tendências ao longo de um período de 12 meses.



