Your graphics add a nice touch to my presentations and I recently used them for one of my all-hands meetings. Your toolbox adds professionalism to my slides. Instead of using standard clipart.
Claude Jones, Director of Engineer, @Walmartlabs, USA
Your graphics add a nice touch to my presentations and I recently used them for one of my all-hands meetings. Your toolbox adds professionalism to my slides. Instead of using standard clipart.
Claude Jones, Director of Engineer, @Walmartlabs, USA
I needed a fresh look at some of my slides. I've tried to find a way to create a paintbrush effect, to underline, accentuate, add some color and the handwritten markers were just the things. Very easy to use, easy to size, change the color. It was an affordable, perfect solution and I'm happy to recommend it.
Anonymous, US
The crisp, clean look of the graphics, and the fact that it allowed me to easily edit and change the colors to match the template was my main reason for purchasing them.
Brandie Jenkins, E-learning Developer, USA
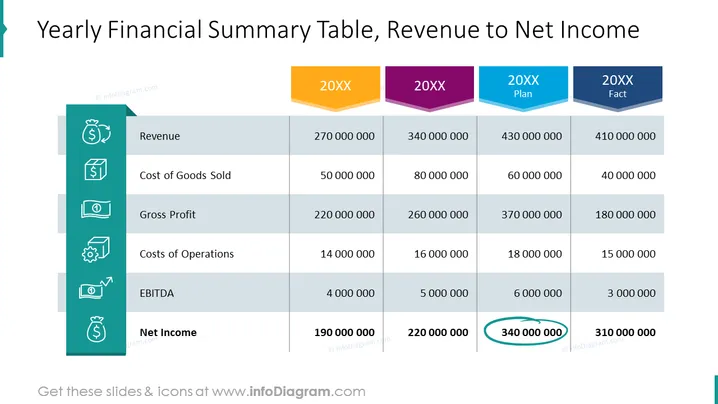
PowerPoint slide illustration with a yearly business review diagram. Show your yearly financial summary report with important metrics such as revenue, costs of sold goods, gross profit, costs of operations, EBITDA, and net income. The slide is a content-ready topic, so you can do only minimal updates, such as writing the factual figures, however, if you wish, you can change the colors and reshape the elements while keeping the quality intact, since all the shapes are vectors. Video editing instructions can be found in the How to Edit section if you don’t have design skills. Click on the picture to see more creative table slide illustrations.
Financial Summary Table, Color Coding, Flat Style Outline Icons, Revenue Icon, Sold Goods 3D Box Icon, Gear Icon, Dollar Sign Icon, Money Bag Icon


