Your graphics add a nice touch to my presentations and I recently used them for one of my all-hands meetings. Your toolbox adds professionalism to my slides. Instead of using standard clipart.
Claude Jones, Director of Engineer, @Walmartlabs, USA
Your graphics add a nice touch to my presentations and I recently used them for one of my all-hands meetings. Your toolbox adds professionalism to my slides. Instead of using standard clipart.
Claude Jones, Director of Engineer, @Walmartlabs, USA
I needed a fresh look at some of my slides. I've tried to find a way to create a paintbrush effect, to underline, accentuate, add some color and the handwritten markers were just the things. Very easy to use, easy to size, change the color. It was an affordable, perfect solution and I'm happy to recommend it.
Anonymous, US
The crisp, clean look of the graphics, and the fact that it allowed me to easily edit and change the colors to match the template was my main reason for purchasing them.
Brandie Jenkins, E-learning Developer, USA
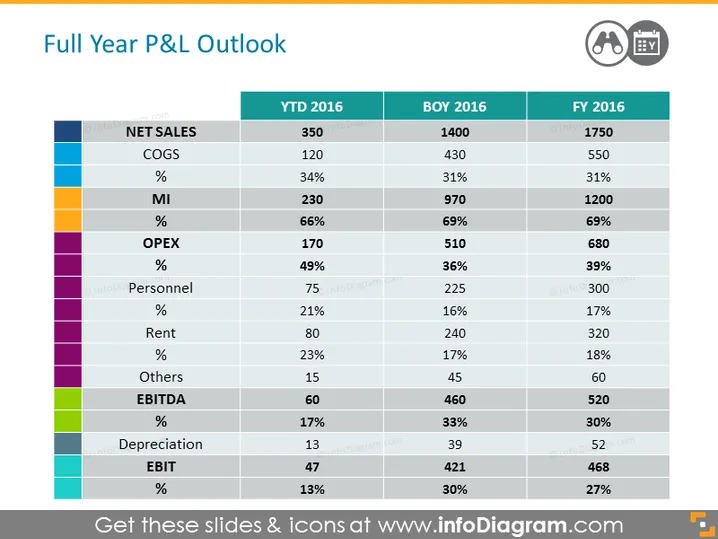
The slide is titled "Full Year P&L Outlook" and displays a financial comparison across three time periods: YTD 2016, BOY 2016, and FY 2016. It includes various key financial metrics such as Net Sales, COGS (Cost of Goods Sold), MI (Margin Income), OPEX (Operational Expenditures), Personnel, Rent, EBITDA (Earnings Before Interest, Taxes, Depreciation, and Amortization), and EBIT (Earnings Before Interest and Taxes) along with corresponding percentages. Each metric category is color-coded and is represented in columns, allowing for quick assessment and comparison of financial health or performance over the specified time frames.
The overall look of the slide is polished and professional, with a clear, structured layout that makes complex data easily digestible. The use of color, bold fonts, and clear categorization helps to distinguish among different financial elements.


