Your graphics add a nice touch to my presentations and I recently used them for one of my all-hands meetings. Your toolbox adds professionalism to my slides. Instead of using standard clipart.
Claude Jones, Director of Engineer, @Walmartlabs, USA
Your graphics add a nice touch to my presentations and I recently used them for one of my all-hands meetings. Your toolbox adds professionalism to my slides. Instead of using standard clipart.
Claude Jones, Director of Engineer, @Walmartlabs, USA
I needed a fresh look at some of my slides. I've tried to find a way to create a paintbrush effect, to underline, accentuate, add some color and the handwritten markers were just the things. Very easy to use, easy to size, change the color. It was an affordable, perfect solution and I'm happy to recommend it.
Anonymous, US
The crisp, clean look of the graphics, and the fact that it allowed me to easily edit and change the colors to match the template was my main reason for purchasing them.
Brandie Jenkins, E-learning Developer, USA
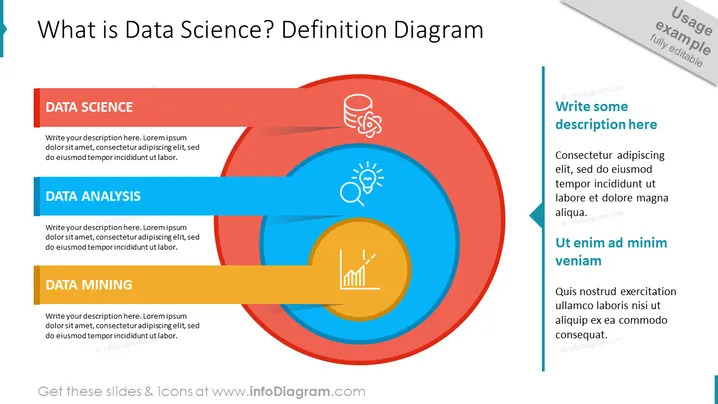
##Slide contents: This PowerPoint Template shows the data science definition in a creative diagram. Data science is the study of extracting meaningful insights from data by combining domain expertise, programming skills, and knowledge of mathematics and statistics. It is important for businesses because data insights help companies increase operational efficiency, recognize new business opportunities, and improve their sales programs. This can lead to a competitive advantage over other businesses. Data analysis is the process of systematically applying statistical and logical techniques to describe and illustrate, and evaluate data. The process of removing and discovering patterns in large amounts of data using methods from data science and machine learning, statistics, and database systems is known as data mining. You can use this PPT Template if you are a marketing manager or human resource manager, or in any industry that generates data. You can also use this diagram if you are a data scientist, data analyst, or data engineer who wants to analyze data after conducting data visualization and data collection with your data science team. You can download this diagram on Google Slides and Keynote.
##Slide infographic description: White Background, Circle Diagram, Colorful Circle Diagram, Text Box, Data Science Icon, Knowledge Discovery Icon, Data Analysis Icon, Prediction Icon, Data Mining Icon


