

Your graphics add a nice touch to my presentations and I recently used them for one of my all-hands meetings. Your toolbox adds professionalism to my slides. Instead of using standard clipart.
Claude Jones, Director of Engineer, @Walmartlabs, USA

Your graphics add a nice touch to my presentations and I recently used them for one of my all-hands meetings. Your toolbox adds professionalism to my slides. Instead of using standard clipart.
Claude Jones, Director of Engineer, @Walmartlabs, USA
I needed a fresh look at some of my slides. I've tried to find a way to create a paintbrush effect, to underline, accentuate, add some color and the handwritten markers were just the things. Very easy to use, easy to size, change the color. It was an affordable, perfect solution and I'm happy to recommend it.
Anonymous, US
The crisp, clean look of the graphics, and the fact that it allowed me to easily edit and change the colors to match the template was my main reason for purchasing them.
Brandie Jenkins, E-learning Developer, USA
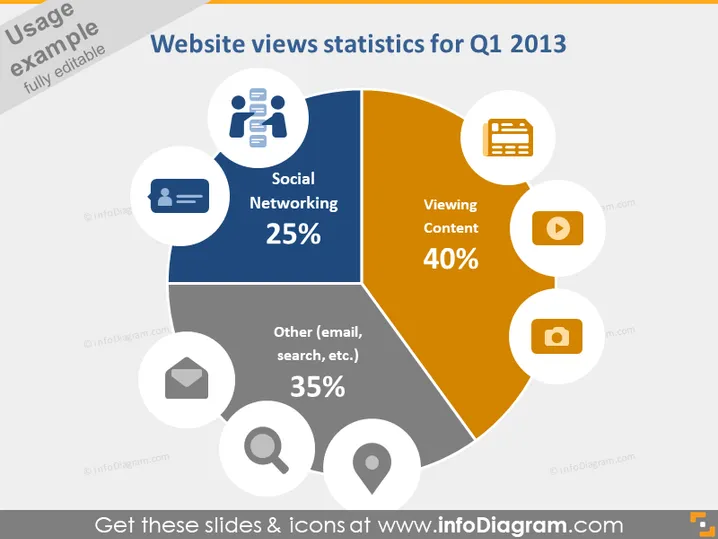
The slide presents a pie chart distribution of website views categorized into three segments: Social Networking at 25%, Viewing Content at 40%, and Other (which includes email, search, etc.) at 35%. Social Networking likely refers to traffic coming from platforms like Facebook or Twitter, Viewing Content represents the page views for actual content on the site, and Other encompasses miscellaneous sources that are not strictly content or social media related.
The slide has a clean and modern look, with a simple color scheme that clearly distinguishes the various data segments. The use of contrasting icons and colors makes it visually engaging and easy to interpret at a glance.



