Your graphics add a nice touch to my presentations and I recently used them for one of my all-hands meetings. Your toolbox adds professionalism to my slides. Instead of using standard clipart.
Claude Jones, Director of Engineer, @Walmartlabs, USA
Your graphics add a nice touch to my presentations and I recently used them for one of my all-hands meetings. Your toolbox adds professionalism to my slides. Instead of using standard clipart.
Claude Jones, Director of Engineer, @Walmartlabs, USA
I needed a fresh look at some of my slides. I've tried to find a way to create a paintbrush effect, to underline, accentuate, add some color and the handwritten markers were just the things. Very easy to use, easy to size, change the color. It was an affordable, perfect solution and I'm happy to recommend it.
Anonymous, US
The crisp, clean look of the graphics, and the fact that it allowed me to easily edit and change the colors to match the template was my main reason for purchasing them.
Brandie Jenkins, E-learning Developer, USA
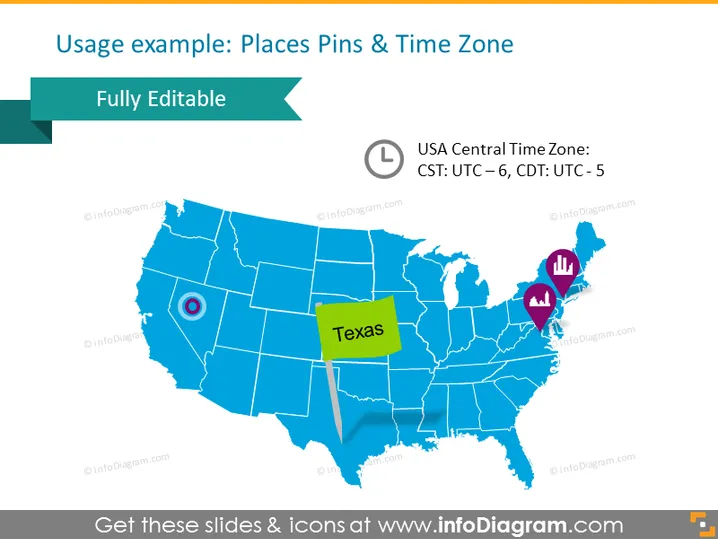
The slide shows an example of how to use place pins and a time zone indication on a map. The specific example focuses on the "USA Central Time Zone," detailing that CST is UTC – 6, and CDT is UTC – 5. This illustrates the use of map annotations to indicate geographical locations, in this case, Texas, and points of interest that may correspond to varying time zones and locations within a particular region.
The slide has a clean and professional appearance, with a limited color palette focused around blues, teal, red, and yellow, which aids in highlighting key information. The graphical elements such as pins, icons, and callout are used effectively to annotate the map with relevant information.


