

Your graphics add a nice touch to my presentations and I recently used them for one of my all-hands meetings. Your toolbox adds professionalism to my slides. Instead of using standard clipart.
Claude Jones, Director of Engineer, @Walmartlabs, USA

Your graphics add a nice touch to my presentations and I recently used them for one of my all-hands meetings. Your toolbox adds professionalism to my slides. Instead of using standard clipart.
Claude Jones, Director of Engineer, @Walmartlabs, USA
I needed a fresh look at some of my slides. I've tried to find a way to create a paintbrush effect, to underline, accentuate, add some color and the handwritten markers were just the things. Very easy to use, easy to size, change the color. It was an affordable, perfect solution and I'm happy to recommend it.
Anonymous, US
The crisp, clean look of the graphics, and the fact that it allowed me to easily edit and change the colors to match the template was my main reason for purchasing them.
Brandie Jenkins, E-learning Developer, USA
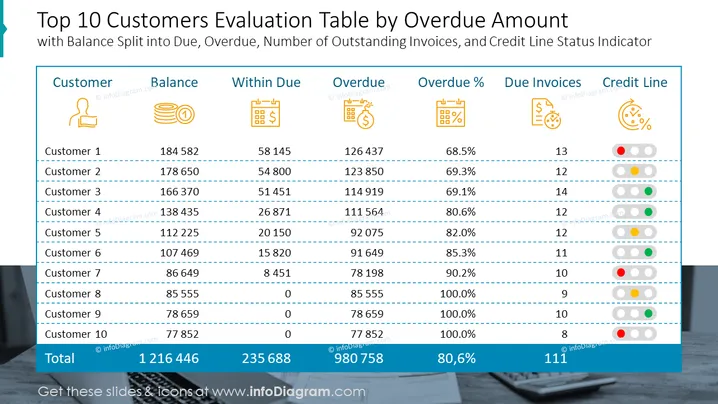
This slide provides a detailed overview of the top 10 customers by financial metrics. It includes data split into categories: Balance, Within Due, Overdue, Overdue Percentage, Due Invoices, and Credit Line. Balance reflects the total amount outstanding, while Within Due indicates amounts not yet past the payment deadline. Overdue encapsulates amounts that have surpassed the due date, and the Overdue Percentage provides a quick metric to assess payment delays. Due Invoices shows the number of invoices still to be paid by the customer, and Credit Line Status Indicator uses colored circles to represent the health of customers' credit lines.
The overall look is professional and clean, with a clear focus on data presentation. Visual aids like icons and color-coded indicators enhance comprehension and quick analysis.



