Your graphics add a nice touch to my presentations and I recently used them for one of my all-hands meetings. Your toolbox adds professionalism to my slides. Instead of using standard clipart.
Claude Jones, Director of Engineer, @Walmartlabs, USA
Your graphics add a nice touch to my presentations and I recently used them for one of my all-hands meetings. Your toolbox adds professionalism to my slides. Instead of using standard clipart.
Claude Jones, Director of Engineer, @Walmartlabs, USA
I needed a fresh look at some of my slides. I've tried to find a way to create a paintbrush effect, to underline, accentuate, add some color and the handwritten markers were just the things. Very easy to use, easy to size, change the color. It was an affordable, perfect solution and I'm happy to recommend it.
Anonymous, US
The crisp, clean look of the graphics, and the fact that it allowed me to easily edit and change the colors to match the template was my main reason for purchasing them.
Brandie Jenkins, E-learning Developer, USA
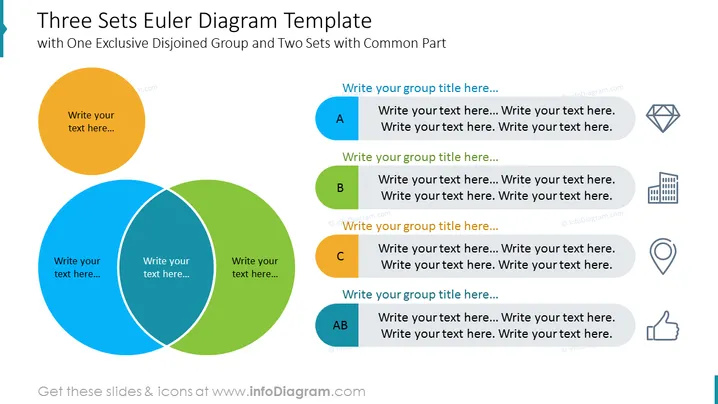
The slide showcases a "Three Sets Euler Diagram Template" that facilitates categorization of elements into three distinct sets and their interrelations. The diagram includes one exclusive, non-overlapping set represented by a golden circle and two overlapping sets in blue and green, indicating shared attributes. Each set has a designated space for text, and there are four additional sections (A, B, C, AB) with customizable text fields for describing the unique and shared characteristics of the groups, as well as corresponding icons to visually aid the presentation of data.
The overall look of the slide is modern and minimalistic with a three-color scheme that clearly distinguishes between different sets and their intersections. The use of icons provides a friendly visual aid that enhances comprehension.


