

Your graphics add a nice touch to my presentations and I recently used them for one of my all-hands meetings. Your toolbox adds professionalism to my slides. Instead of using standard clipart.
Claude Jones, Director of Engineer, @Walmartlabs, USA

Your graphics add a nice touch to my presentations and I recently used them for one of my all-hands meetings. Your toolbox adds professionalism to my slides. Instead of using standard clipart.
Claude Jones, Director of Engineer, @Walmartlabs, USA
I needed a fresh look at some of my slides. I've tried to find a way to create a paintbrush effect, to underline, accentuate, add some color and the handwritten markers were just the things. Very easy to use, easy to size, change the color. It was an affordable, perfect solution and I'm happy to recommend it.
Anonymous, US
The crisp, clean look of the graphics, and the fact that it allowed me to easily edit and change the colors to match the template was my main reason for purchasing them.
Brandie Jenkins, E-learning Developer, USA
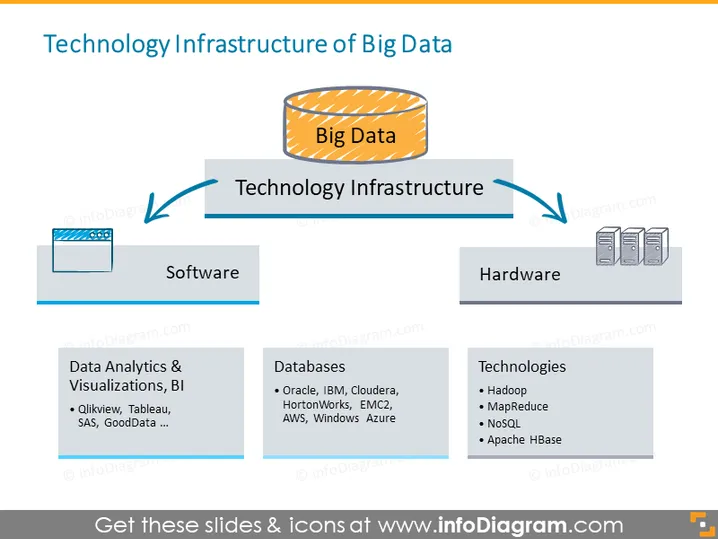
The slide illustrates the core components that comprise the Technology Infrastructure of Big Data. There is a central concept, "Big Data," connected to two broad categories: 'Software' and 'Hardware.' Each category has a respective list expanding on the types of software and hardware utilized. For software, 'Data Analytics & Visualizations, BI' includes tools like Qlikview, Tableau, SAS, and GoodData. In terms of databases, examples given are Oracle, IBM, and Cloudera. The hardware side lists 'Technologies' such as Hadoop, MapReduce, NoSQL, and Apache HBase, indicating the variety of technologies used to handle big data processing and storage.
The slide uses a clear, straightforward layout with a central focal point and associated categories branching off. The use of icons and arrangement provides an easy-to-follow visual representation of the relationship between Big Data and its underlying technology infrastructure.



