

Your graphics add a nice touch to my presentations and I recently used them for one of my all-hands meetings. Your toolbox adds professionalism to my slides. Instead of using standard clipart.
Claude Jones, Director of Engineer, @Walmartlabs, USA

Your graphics add a nice touch to my presentations and I recently used them for one of my all-hands meetings. Your toolbox adds professionalism to my slides. Instead of using standard clipart.
Claude Jones, Director of Engineer, @Walmartlabs, USA
I needed a fresh look at some of my slides. I've tried to find a way to create a paintbrush effect, to underline, accentuate, add some color and the handwritten markers were just the things. Very easy to use, easy to size, change the color. It was an affordable, perfect solution and I'm happy to recommend it.
Anonymous, US
The crisp, clean look of the graphics, and the fact that it allowed me to easily edit and change the colors to match the template was my main reason for purchasing them.
Brandie Jenkins, E-learning Developer, USA
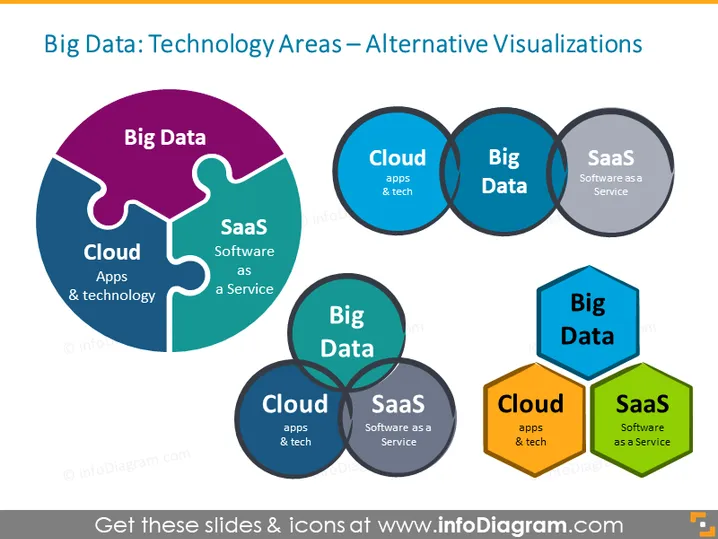
The PowerPoint slide is focused on showing the interconnectedness of three key technology areas: Big Data, Cloud (apps & tech), and SaaS (Software as a Service). The diagram demonstrates how these three sectors overlap and are complementary to each other. Big Data involves the handling and analysis of vast amounts of data. Cloud refers to cloud computing technologies and services that provide remote infrastructure, platforms, or software. SaaS is a software distribution model in which applications are hosted by a third-party provider and accessed via the internet.
The slide is visually engaging with its use of shapes and color to represent the relationship between the technology phenomena. The design uses puzzle pieces, overlapping circles, and honeycomb hexagons to symbolize interconnectivity and cohesion.



