Your graphics add a nice touch to my presentations and I recently used them for one of my all-hands meetings. Your toolbox adds professionalism to my slides. Instead of using standard clipart.
Claude Jones, Director of Engineer, @Walmartlabs, USA
Your graphics add a nice touch to my presentations and I recently used them for one of my all-hands meetings. Your toolbox adds professionalism to my slides. Instead of using standard clipart.
Claude Jones, Director of Engineer, @Walmartlabs, USA
I needed a fresh look at some of my slides. I've tried to find a way to create a paintbrush effect, to underline, accentuate, add some color and the handwritten markers were just the things. Very easy to use, easy to size, change the color. It was an affordable, perfect solution and I'm happy to recommend it.
Anonymous, US
The crisp, clean look of the graphics, and the fact that it allowed me to easily edit and change the colors to match the template was my main reason for purchasing them.
Brandie Jenkins, E-learning Developer, USA
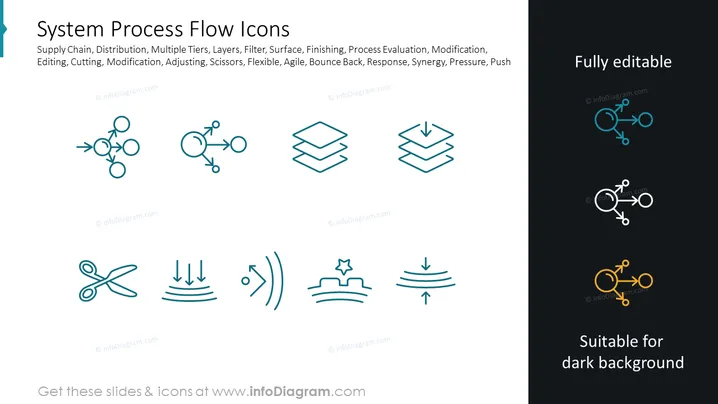
The slide presents a collection of icons to represent various system process flow concepts. Keywords such as Supply Chain, Distribution, Layers, and Agile indicate that these icons are intended for depicting the flow and interaction of processes in a systematic manner. For example, the icon representing scissors signifies Editing, Cutting or Modification, which means altering or tailoring processes. The connected circles may imply Distribution or Multiple Tiers of operations working together. The stack of layers relates to multiple stages in a process, symbolizing how processes are built up or reduced down. The arrows with hits of impact denote Response, Pressure, or Push, signifying reaction or driving force within a system.
The slide has a clean and professional design with a structured layout. The use of contrasting icon colors makes it easy to differentiate between highlighted concepts.


