Your graphics add a nice touch to my presentations and I recently used them for one of my all-hands meetings. Your toolbox adds professionalism to my slides. Instead of using standard clipart.
Claude Jones, Director of Engineer, @Walmartlabs, USA
Your graphics add a nice touch to my presentations and I recently used them for one of my all-hands meetings. Your toolbox adds professionalism to my slides. Instead of using standard clipart.
Claude Jones, Director of Engineer, @Walmartlabs, USA
I needed a fresh look at some of my slides. I've tried to find a way to create a paintbrush effect, to underline, accentuate, add some color and the handwritten markers were just the things. Very easy to use, easy to size, change the color. It was an affordable, perfect solution and I'm happy to recommend it.
Anonymous, US
The crisp, clean look of the graphics, and the fact that it allowed me to easily edit and change the colors to match the template was my main reason for purchasing them.
Brandie Jenkins, E-learning Developer, USA
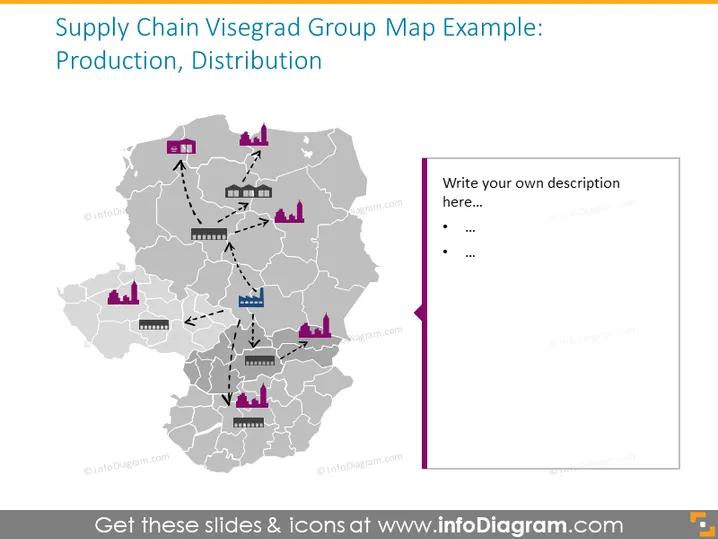
The slide titled 'Supply Chain Visegrad Group Map Example: Production, Distribution' likely portrays a logistical network within the Visegrad Group, which includes countries like Poland, Czech Republic, Slovakia, and Hungary. It shows a stylized map with icons representing warehouses, factories, and arrows indicating movement between them—depicting production and distribution points that form the supply chain within this region.
The slide takes on a professional and clean visual theme with its minimalistic color palette and clear separation of graphical and text elements. It effectively employs icons and arrows to depict connections and flow within a supply chain.


