Your graphics add a nice touch to my presentations and I recently used them for one of my all-hands meetings. Your toolbox adds professionalism to my slides. Instead of using standard clipart.
Claude Jones, Director of Engineer, @Walmartlabs, USA
Your graphics add a nice touch to my presentations and I recently used them for one of my all-hands meetings. Your toolbox adds professionalism to my slides. Instead of using standard clipart.
Claude Jones, Director of Engineer, @Walmartlabs, USA
I needed a fresh look at some of my slides. I've tried to find a way to create a paintbrush effect, to underline, accentuate, add some color and the handwritten markers were just the things. Very easy to use, easy to size, change the color. It was an affordable, perfect solution and I'm happy to recommend it.
Anonymous, US
The crisp, clean look of the graphics, and the fact that it allowed me to easily edit and change the colors to match the template was my main reason for purchasing them.
Brandie Jenkins, E-learning Developer, USA
##Slide content:
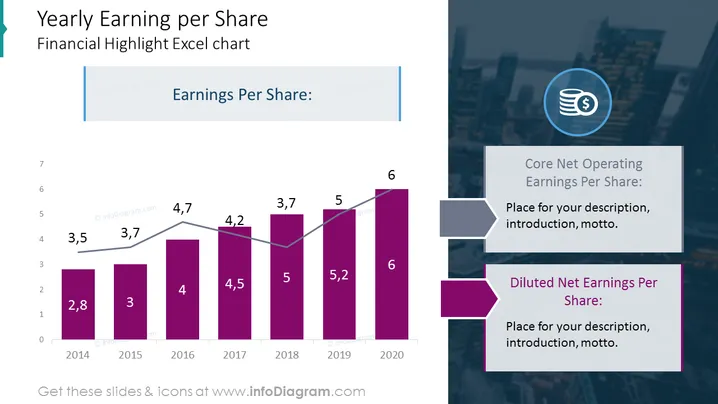
The earnings per share PPT shows the yearly earnings in a financial highlight Excel chart. In this example, we presented it from 2014 up to 2020. The growth bar chart presents the diluted EPS or diluted net earnings per share, while the grey line shows the core net operating earnings per share. We have added also space for a description where you can briefly write your introduction and/or your motto. All the graphics are editable, so you can adjust them to your presentation needs. This slide is part of the Stock Financial Annual Report PowerPoint Template. Click on the picture to see the whole PowerPoint presentation. You can download it in other formats such as Excel or PDF, and it's compatible with other software such as Google Slides and Keynote.
##Slide infographic description:
Bar Chart, Excel Chart, Line Vector, Text Box, Outline Arrow Vector, City View Picture Background, Money Dollar Icon


