Your graphics add a nice touch to my presentations and I recently used them for one of my all-hands meetings. Your toolbox adds professionalism to my slides. Instead of using standard clipart.
Claude Jones, Director of Engineer, @Walmartlabs, USA
Your graphics add a nice touch to my presentations and I recently used them for one of my all-hands meetings. Your toolbox adds professionalism to my slides. Instead of using standard clipart.
Claude Jones, Director of Engineer, @Walmartlabs, USA
I needed a fresh look at some of my slides. I've tried to find a way to create a paintbrush effect, to underline, accentuate, add some color and the handwritten markers were just the things. Very easy to use, easy to size, change the color. It was an affordable, perfect solution and I'm happy to recommend it.
Anonymous, US
The crisp, clean look of the graphics, and the fact that it allowed me to easily edit and change the colors to match the template was my main reason for purchasing them.
Brandie Jenkins, E-learning Developer, USA
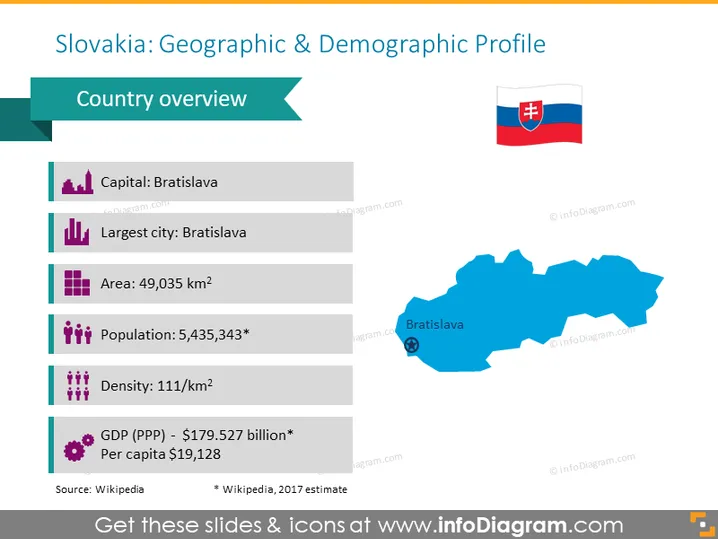
This PowerPoint slide contains [Slovakia Demographics] (https://en.wikipedia.org/wiki/Demographics_of_Slovakia): capital, largest city, area, population, density, and GDP. You can use this PPT slide if you want to develop a market strategy with your team. All graphics are editable, and you can change the size and color without losing quality. Check out the editing instructions in the How to Edit section. You can download this PPT template on Google Slides and Keynote.
White Background, Map Vector, Slovakia Flag, Location Pin Icon, Capital Icon, City Icon, Area Icon, Population Icon, Population Density Icon, GDP Icon


