Your graphics add a nice touch to my presentations and I recently used them for one of my all-hands meetings. Your toolbox adds professionalism to my slides. Instead of using standard clipart.
Claude Jones, Director of Engineer, @Walmartlabs, USA
Your graphics add a nice touch to my presentations and I recently used them for one of my all-hands meetings. Your toolbox adds professionalism to my slides. Instead of using standard clipart.
Claude Jones, Director of Engineer, @Walmartlabs, USA
I needed a fresh look at some of my slides. I've tried to find a way to create a paintbrush effect, to underline, accentuate, add some color and the handwritten markers were just the things. Very easy to use, easy to size, change the color. It was an affordable, perfect solution and I'm happy to recommend it.
Anonymous, US
The crisp, clean look of the graphics, and the fact that it allowed me to easily edit and change the colors to match the template was my main reason for purchasing them.
Brandie Jenkins, E-learning Developer, USA
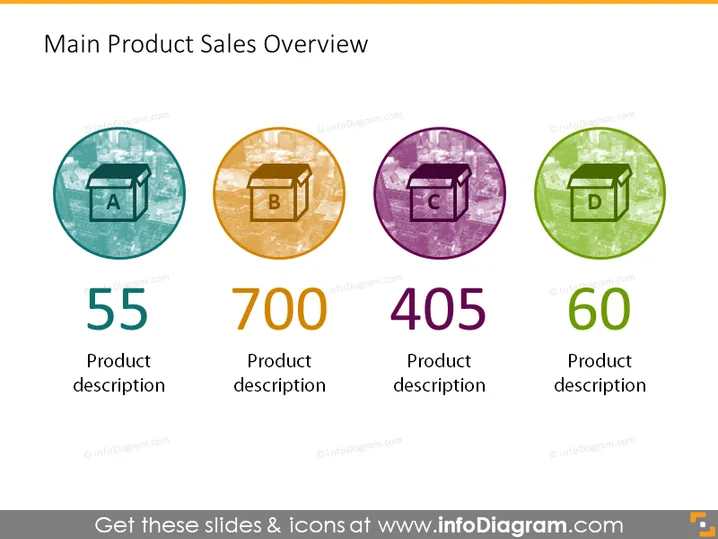
The slide titled "Main Product Sales Overview" provides a concise summary of sales figures for four main products labeled A, B, C, and D. These products have corresponding sales quantities presented as large numerical figures: 55, 700, 405, and 60, underneath which, each has a placeholder for a brief product description, suggesting a snapshot of performance or significance of the products. The differentiation in colors and icons hints at distinct product categories or characteristics.
The slide exhibits a clean and modern design with a focus on clarity and readability. The use of color-coding and stylish icons makes it visually engaging and helps convey the data at a glance.


