

Your graphics add a nice touch to my presentations and I recently used them for one of my all-hands meetings. Your toolbox adds professionalism to my slides. Instead of using standard clipart.
Claude Jones, Director of Engineer, @Walmartlabs, USA

Your graphics add a nice touch to my presentations and I recently used them for one of my all-hands meetings. Your toolbox adds professionalism to my slides. Instead of using standard clipart.
Claude Jones, Director of Engineer, @Walmartlabs, USA
I needed a fresh look at some of my slides. I've tried to find a way to create a paintbrush effect, to underline, accentuate, add some color and the handwritten markers were just the things. Very easy to use, easy to size, change the color. It was an affordable, perfect solution and I'm happy to recommend it.
Anonymous, US
The crisp, clean look of the graphics, and the fact that it allowed me to easily edit and change the colors to match the template was my main reason for purchasing them.
Brandie Jenkins, E-learning Developer, USA
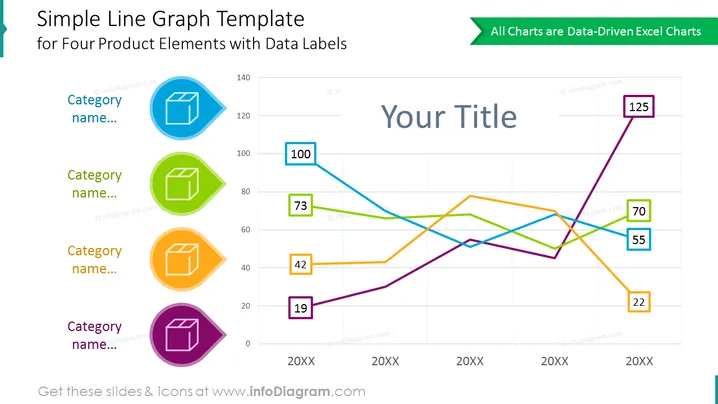
The slide is a visual representation showing a line graph for four distinct categories, each with a unique color and data labels that indicate specific values at different time points. These points are likely capturing some form of performance metric or similar data over three time periods labeled as "20XX." Each category's trajectory can be analyzed to determine trends, performance, or to compare against the other categories. The slide appears to be designed for presenting quantitative comparisons in a clear and succinct manner.
The overall look of the slide is clean and modern with a professional color scheme. The visual elements are aligned and organized in a way that promotes easy interpretation of the data presented.



