Your graphics add a nice touch to my presentations and I recently used them for one of my all-hands meetings. Your toolbox adds professionalism to my slides. Instead of using standard clipart.
Claude Jones, Director of Engineer, @Walmartlabs, USA
Your graphics add a nice touch to my presentations and I recently used them for one of my all-hands meetings. Your toolbox adds professionalism to my slides. Instead of using standard clipart.
Claude Jones, Director of Engineer, @Walmartlabs, USA
I needed a fresh look at some of my slides. I've tried to find a way to create a paintbrush effect, to underline, accentuate, add some color and the handwritten markers were just the things. Very easy to use, easy to size, change the color. It was an affordable, perfect solution and I'm happy to recommend it.
Anonymous, US
The crisp, clean look of the graphics, and the fact that it allowed me to easily edit and change the colors to match the template was my main reason for purchasing them.
Brandie Jenkins, E-learning Developer, USA
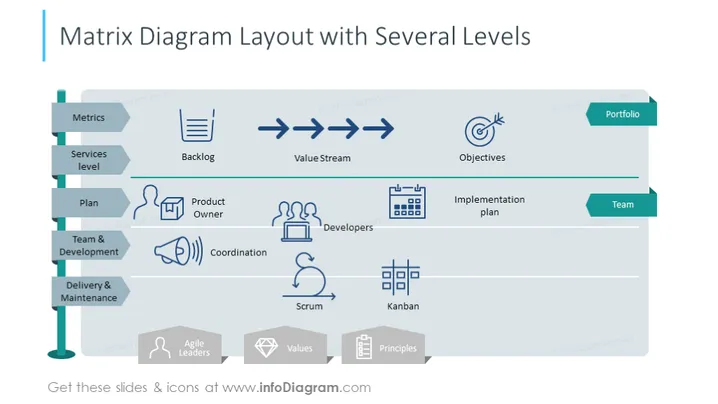
The slide depicts a matrix diagram that organizes various aspects of project management across different levels. 'Metrics' and 'Services level' indicate measures of performance and the stratification of services provided. The 'Backlog' serves as a repository of tasks to be addressed. 'Value Stream' represents the sequence of steps that an organization uses to build a product. 'Objectives' are the goals set for the project, while 'Portfolio' encompasses the range of projects managed. 'Plan', 'Product Owner', 'Team & Development', and 'Delivery & Maintenance' correspond to planning phases, the role responsible for the product vision, the development team's work, and the ongoing support post-development. 'Coordination', 'Developers', 'Scrum', and 'Kanban' refer to the management of tasks, the technical staff, and the agile methodologies applied.
The slide's design is modern and structured, using a matrix layout to delineate the relationships and flow between different components of project management. The icons and color coding provide an intuitive guide for the viewer to follow the process from conception to maintenance.


