Your graphics add a nice touch to my presentations and I recently used them for one of my all-hands meetings. Your toolbox adds professionalism to my slides. Instead of using standard clipart.
Claude Jones, Director of Engineer, @Walmartlabs, USA
Your graphics add a nice touch to my presentations and I recently used them for one of my all-hands meetings. Your toolbox adds professionalism to my slides. Instead of using standard clipart.
Claude Jones, Director of Engineer, @Walmartlabs, USA
I needed a fresh look at some of my slides. I've tried to find a way to create a paintbrush effect, to underline, accentuate, add some color and the handwritten markers were just the things. Very easy to use, easy to size, change the color. It was an affordable, perfect solution and I'm happy to recommend it.
Anonymous, US
The crisp, clean look of the graphics, and the fact that it allowed me to easily edit and change the colors to match the template was my main reason for purchasing them.
Brandie Jenkins, E-learning Developer, USA
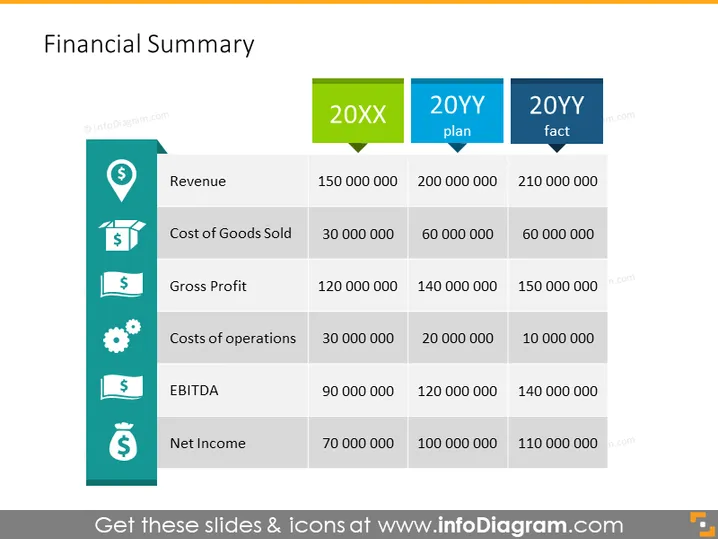
The Financial Summary PPT Template can be used to communicate the financial performance of your company. For example, you can use this PPT slide during board meetings to evaluate the company's financial performance, make strategic decisions, and provide guidance. It allows for an in-depth analysis of financial data and facilitates discussions around financial goals and initiatives. You can compare your current year data to current planned and previous year data. You can also add icons to make your presentation more creative. All shapes are vectors, so you can play with the colors and resize the elements without losing quality. You can download this PPT template on Google Slides and Keynote.
White Background, Text Box, Revenue Icon, Product Box Icon, Money Icon, Dollar Icon, Operations Icon


