Your graphics add a nice touch to my presentations and I recently used them for one of my all-hands meetings. Your toolbox adds professionalism to my slides. Instead of using standard clipart.
Claude Jones, Director of Engineer, @Walmartlabs, USA
Your graphics add a nice touch to my presentations and I recently used them for one of my all-hands meetings. Your toolbox adds professionalism to my slides. Instead of using standard clipart.
Claude Jones, Director of Engineer, @Walmartlabs, USA
I needed a fresh look at some of my slides. I've tried to find a way to create a paintbrush effect, to underline, accentuate, add some color and the handwritten markers were just the things. Very easy to use, easy to size, change the color. It was an affordable, perfect solution and I'm happy to recommend it.
Anonymous, US
The crisp, clean look of the graphics, and the fact that it allowed me to easily edit and change the colors to match the template was my main reason for purchasing them.
Brandie Jenkins, E-learning Developer, USA
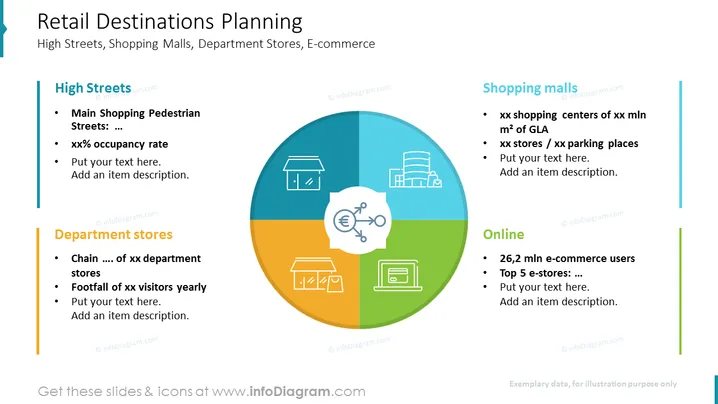
This slide presents the location opportunities in retail in a circular shape diagram with high streets, shopping malls, department stores, and e-commerce/online. Explain the main pedestrian street's occupancy rate, the number of shopping centers in a gross living area, the number of stores and parking places, the number of chain department stores, and the average number of annual visitors. For your e-commerce/online presence write the number of e-commerce users and the top 5 e-stores where you'd like to promote and sell your product or service. You can add a specific description and comments under the bullet points and reshape the elements however you wish, without any quality loss. Click on the slide to see more illustration ideas for creating a GTM strategy presentation.
##Slide infographic description:
Circular Shape Diagram, Store Icon, Mall Icon, Department Store Icon, Laptop Icon, Line Vector, Bullet Points, Outline Icons


