Your graphics add a nice touch to my presentations and I recently used them for one of my all-hands meetings. Your toolbox adds professionalism to my slides. Instead of using standard clipart.
Claude Jones, Director of Engineer, @Walmartlabs, USA
Your graphics add a nice touch to my presentations and I recently used them for one of my all-hands meetings. Your toolbox adds professionalism to my slides. Instead of using standard clipart.
Claude Jones, Director of Engineer, @Walmartlabs, USA
I needed a fresh look at some of my slides. I've tried to find a way to create a paintbrush effect, to underline, accentuate, add some color and the handwritten markers were just the things. Very easy to use, easy to size, change the color. It was an affordable, perfect solution and I'm happy to recommend it.
Anonymous, US
The crisp, clean look of the graphics, and the fact that it allowed me to easily edit and change the colors to match the template was my main reason for purchasing them.
Brandie Jenkins, E-learning Developer, USA
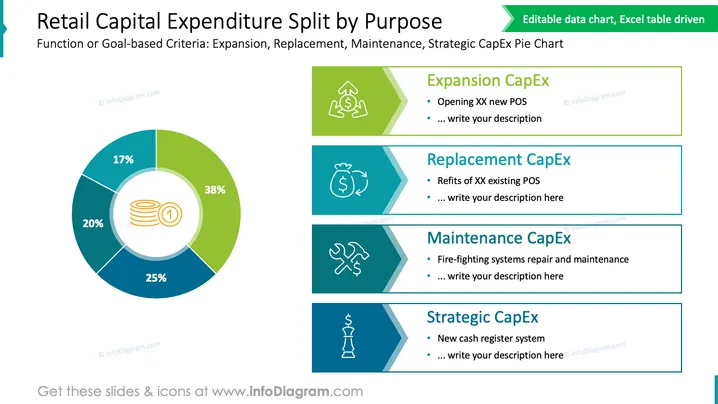
The slide displays the breakdown of retail capital expenditure (CapEx) based on functional or goal-oriented criteria such as Expansion, Replacement, Maintenance, and Strategic expenditures. Expansion CapEx (38%) is for opening new points of sale (POS), Replacement CapEx (20%) refers to refits of existing POS, Maintenance CapEx (25%) covers repairs and maintenance such as fire-fighting systems, and Strategic CapEx (17%) includes significant investments like a new cash register system.
The slide has a clean and professional look, with a well-organized layout that allows for easy interpretation of the data. The use of icons and color coordination aids in visually correlating the text descriptions with the pie chart segments.


