Your graphics add a nice touch to my presentations and I recently used them for one of my all-hands meetings. Your toolbox adds professionalism to my slides. Instead of using standard clipart.
Claude Jones, Director of Engineer, @Walmartlabs, USA
Your graphics add a nice touch to my presentations and I recently used them for one of my all-hands meetings. Your toolbox adds professionalism to my slides. Instead of using standard clipart.
Claude Jones, Director of Engineer, @Walmartlabs, USA
I needed a fresh look at some of my slides. I've tried to find a way to create a paintbrush effect, to underline, accentuate, add some color and the handwritten markers were just the things. Very easy to use, easy to size, change the color. It was an affordable, perfect solution and I'm happy to recommend it.
Anonymous, US
The crisp, clean look of the graphics, and the fact that it allowed me to easily edit and change the colors to match the template was my main reason for purchasing them.
Brandie Jenkins, E-learning Developer, USA
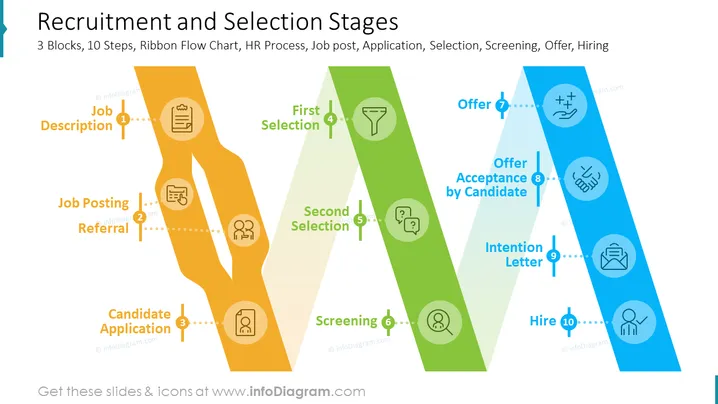
This PowerPoint slide presents an infographic that explains the recruitment and selection stages with examples.
The slide contains a Flow Chart Diagram with descriptions and visual representation HR stages:
The infographic is divided into three blocks, each representing a different stage of the process. Each block is represented by a different color: orange for the job posting and referral application stages, green for the screening and selection stages, and blue for the offer acceptance and hiring stages.
Each stage is represented by an icon and a brief description, making it easy to understand at a glance. The icons are simple and clear, effectively conveying the meaning of each stage.
The infographic is white in color with a blue border, giving it a clean and professional look. This PPT slide uses infographics to visually represent complex processes, making them easier to understand and remember.


