Your graphics add a nice touch to my presentations and I recently used them for one of my all-hands meetings. Your toolbox adds professionalism to my slides. Instead of using standard clipart.
Claude Jones, Director of Engineer, @Walmartlabs, USA
Your graphics add a nice touch to my presentations and I recently used them for one of my all-hands meetings. Your toolbox adds professionalism to my slides. Instead of using standard clipart.
Claude Jones, Director of Engineer, @Walmartlabs, USA
I needed a fresh look at some of my slides. I've tried to find a way to create a paintbrush effect, to underline, accentuate, add some color and the handwritten markers were just the things. Very easy to use, easy to size, change the color. It was an affordable, perfect solution and I'm happy to recommend it.
Anonymous, US
The crisp, clean look of the graphics, and the fact that it allowed me to easily edit and change the colors to match the template was my main reason for purchasing them.
Brandie Jenkins, E-learning Developer, USA
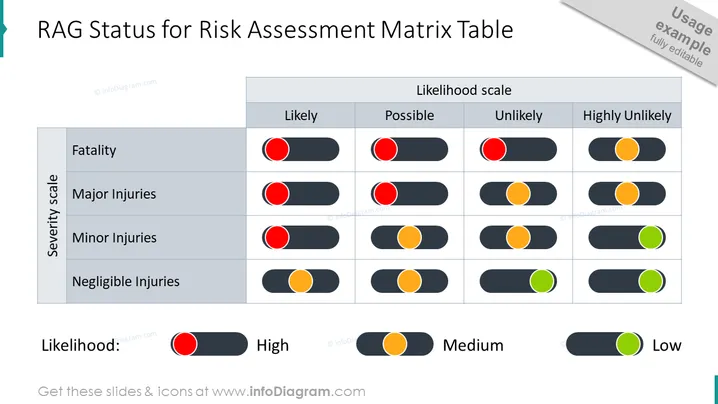
The slide presents a risk assessment matrix for evaluating the severity of potential incidents against their likelihood. Severity levels such as Fatality, Major Injuries, Minor Injuries, and Negligible Injuries are cross-referenced with the likelihood categories Likely, Possible, Unlikely, and Highly Unlikely. Each intersection in the matrix is marked with a RAG (Red, Amber, Green) status indicator, denoting the risk level, with red signaling high risk, amber indicating medium risk, and green representing low risk.
The slide is clean and methodically organized, using color contrasts to emphasize the RAG status indicators within the matrix for easy interpretation.
This slide is ideal for safety briefings, risk management meetings, or any business presentation that requires a clear visual representation of risk assessment. It can be used in various industries to prioritize safety measures and risk mitigation strategies.


