Your graphics add a nice touch to my presentations and I recently used them for one of my all-hands meetings. Your toolbox adds professionalism to my slides. Instead of using standard clipart.
Claude Jones, Director of Engineer, @Walmartlabs, USA
Your graphics add a nice touch to my presentations and I recently used them for one of my all-hands meetings. Your toolbox adds professionalism to my slides. Instead of using standard clipart.
Claude Jones, Director of Engineer, @Walmartlabs, USA
I needed a fresh look at some of my slides. I've tried to find a way to create a paintbrush effect, to underline, accentuate, add some color and the handwritten markers were just the things. Very easy to use, easy to size, change the color. It was an affordable, perfect solution and I'm happy to recommend it.
Anonymous, US
The crisp, clean look of the graphics, and the fact that it allowed me to easily edit and change the colors to match the template was my main reason for purchasing them.
Brandie Jenkins, E-learning Developer, USA
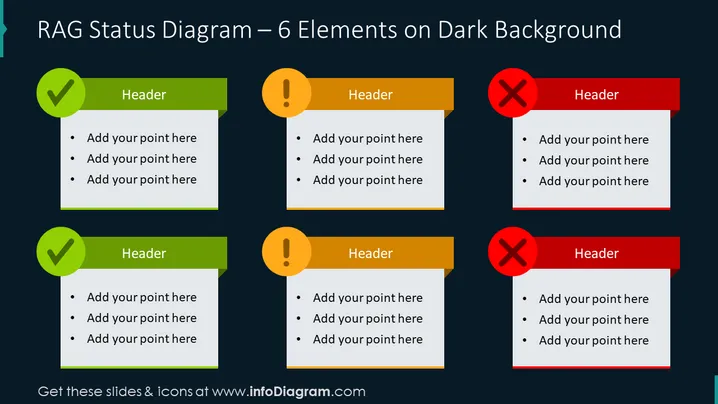
The slide is a RAG (Red, Amber, Green) status diagram with six elements, each with a corresponding header. It provides a structured format for itemizing and detailing points under each status category: green for satisfactory or completed items, amber for warnings or items requiring attention, and red for critical issues or actions needed. This system helps in prioritizing tasks and identifying areas of concern in a project or operational workflow.
The graphical design is bold and straightforward, with contrasting colors that make the status distinctions immediately apparent. The dark background accentuates the colored headers and ensures readability.
This slide would be suitable for project management meetings, status update presentations, risk assessments, or any management scenario where visualizing task priorities and statuses is crucial.


