Reviews
Ihre Grafiken verleihen meinen Präsentationen eine nette Note, und ich habe sie kürzlich für eines meiner All-Hands-Meetings verwendet. Ihre Toolbox verleiht meinen Folien Professionalität, anstatt Standard-Clipart zu verwenden.
Ich brauchte einen neuen Blick auf einige meiner Folien. Ich habe versucht, einen Weg zu finden, einen Pinselschlag-Effekt zu erzielen, um zu unterstreichen, hervorzuheben, Farbe hinzuzufügen, und die handgeschriebenen Markierungen waren genau das Richtige. Sehr einfach zu bedienen, leicht in der Größe zu ändern, die Farbe zu ändern. Es war eine erschwingliche, perfekte Lösung und ich empfehle sie gerne weiter.
Die klare, saubere Optik der Grafiken und die Tatsache, dass ich die Farben leicht bearbeiten und an die Vorlage anpassen konnte, war mein Hauptgrund für den Kauf.
Description
Production OEE Dashboard
Slide Content
The PowerPoint slide is titled "Production OEE Dashboard" and delves into three key performance indicators (KPIs) for manufacturing: Availability, Performance, and Quality. Availability is at 93.34% with details on planned vs. actual runtime, leading to 190 hours of unplanned downtime. Performance measures at 95.71%, indicating a small shortfall between planned and actual production quantities. Finally, Quality stands at 93.03%, describing the accepted quantity of products versus rejected ones after a quality check. The overall equipment effectiveness (OEE) is evaluated at 83.10%. The slide includes a footnote stating an improvement over the previous year's period.
Graphical Look
- The slide background is white with a large title in dark blue at the top.
- The subtitle is in smaller font and is colored in a lighter shade of blue beneath the title.
- Three main sections are encapsulated within distinct colored boxes: orange, blue, and purple, symbolizing Availability, Performance, and Quality respectively.
- Each box contains a large percentage value reflecting the specific KPI.
- Beneath the percentage values are bar charts comparing Planned vs Actual data for each KPI, with quantitative data represented in different tones of the section's color.
- There is a geometrically shaped sidebar on the left, in a very light blue, containing the OEE percentage in large font size.
- A blue arrow extends from the OEE side panel, pointing towards an area with narrative text.
- The narrative text is presented in two lines in a white space beneath the arrow, providing context for the OEE percentage.
- At the bottom right, there is an icon depicting gears, signifying a connection to the industry or mechanical processes.
The slide is visually clean and uses contrasting colors to differentiate between sections, making the information easy to digest at a glance. The use of bars and bold percentages draws attention to the key metrics.
Use Cases ## Production OEE Dashboard
Slide Content
The slide is focused on a "Production OEE Dashboard" displaying Overall Equipment Effectiveness including aspects such as Availability, Performance, and Quality Analysis. The Availability section shows a KPI of 93.34%, breaking down the planned runtime (2,920 hours) against actual runtime (2,730 hours), resulting in 190 unplanned downtime hours. Performance is noted at 95.71%, with planned quantity (105,000 units) compared to actual quantity produced (100,500 units), accounting for 4,500 units missed. The Quality segment indicates a 93.03% success rate, contrasting actual quantity (100,500 units) with accepted quantity (93,500 units), highlighting 7,000 rejected units. The OEE benchmark is indicated at 83.10%, suggesting room for improvement.
Graphical Look
- The slide title "Production OEE Dashboard" is prominently displayed at the top in a dark blue font.
- A lighter blue subtitle beneath the title highlights the main aspects of the dashboard.
- Three colored header boxes in shades of orange, blue, and purple represent the key areas: Availability, Performance, and Quality, each with a highlighted KPI percentage.
- Bar charts within each colored box graphically display the comparison of planned vs actual figures, with differentiated color intensities to distinguish the data.
- The left sidebar shows the overall OEE percentage in a large font against a light blue background, along with a big arrow pointing towards additional textual information.
- Descriptive text below the arrow provides context for the OEE value and suggests an improvement over the last year's period.
- A gear icon is located at the bottom right, signifying the industrial theme of the dashboard.
The slide employs a professional and clean design with distinct blocks of color and clear graphical elements that make interpreting the data intuitive. The layout is well-organized, with visual cues that guide the viewer through the various metrics and their ## Production OEE Dashboard
Slide Content
The "Production OEE Dashboard" slide provides an overview of a manufacturing system's Overall Equipment Effectiveness (OEE), detailing three main components: Availability (93.34%), Performance (95.71%), and Quality (93.03%). The Availability segment outlines the planned and actual runtime, with a visual emphasis on the difference termed 'Unplanned Downtime'. Performance compares the planned and actual quantities of production, noting the shortfall as 'Missed Quantity'. Quality contrasts the actual quantity produced with the accepted quantity post-quality check, highlighting the 'Rejected Quantity'. The slide culminates in an OEE score of 83.10%, with a footnote remarking on an efficiency improvement from the last year. Each section includes bar charts and numerical data supporting the visualized KPIs.
Graphical Look
- The slide's title is in large dark blue font.
- Below the title, a descriptive subtitle in a smaller light blue font addresses the key points.
- The Availability, Performance, and Quality sections are color-coded with header boxes in orange, blue, and purple, respectively, each featuring a percentage in white font.
- Bar charts within the colored sections visually represent the data, with lighter shades indicating planned figures and darker shades for actual or outcome figures.
- The left-side panel in light blue displays the overall OEE percentage prominently.
- A blue arrow points from the OEE percentage to a text block that provides additional context.
- Bottom right features an industrial gear icon in yellow-brown, symbolizing the manufacturing focus of the dashboard.
This slide is aesthetically organized, using color-blocking to segment different KPIs and utilizing bar charts for clear data comparison. The contrasting colors and design elements create a visually effective summary of equipment performance metrics.
Use Cases
- During a manufacturing management meeting to present current performance stats and areas for improvement.
- In a stakeholder or investor presentation to demonstrate the effectiveness and efficiency of ## Production OEE Dashboard
Slide Content
The slide titled "Production OEE Dashboard" encompasses critical metrics of manufacturing effectiveness, presenting Overall Equipment Effectiveness (OEE) and its underlying components. Availability is showcased at 93.34% based on planned versus actual runtime, with an explicit callout of unplanned downtime. Performance is depicted at 95.71%, comparing planned to actual production quantities, highlighting the missed quantity. Quality comes in at 93.03%, contrasting actual production quantity with the accepted amount post-inspection, which in turn reveals the rejected quantity. The slide suggests a current OEE of 83.10%, a performance improvement when compared to the previous year, illustrated via a bar graph and annotated metrics.
Graphical Look
- A prominent, dark blue title at the top of the slide reads "Production OEE Dashboard."
- A light blue subtitle below the main title outlines the focus areas of the dashboard.
- Three key metric areas are highlighted within individual boxes in orange (Availability), blue (Performance), and purple (Quality), each featuring a white percentage.
- Bar charts within these boxes visualize Planned vs. Actual numbers, color-coded to match the section they represent.
- A sidebar on the left, in pale blue, features the overall OEE percentage in a large, bold font.
- A blue arrow stems from the OEE sidebar and points towards a block of narrative text, providing interpretations of the OEE figure.
- An industrial gear icon sits at the lower right, adding a thematic visual element to the slide.
The slide has a clean, professional look with a well-structured layout that uses color to differentiate between sections and graphical elements such as bar charts and bold fonts to highlight key data, making it easy to understand at a glance.
Use Cases
- During operational reviews to analyze and discuss manufacturing performance with plant managers or production teams.
- Inboard or investor meetings to report on manufacturing efficiency and identify areas for potential investment.
- For continuous ## Production OEE Dashboard
Slide Content
The slide outlines the "Production OEE Dashboard," which covers the Overall Equipment Effectiveness (OEE) across three categories: Availability, Performance, and Quality. Availability is noted at 93.34%, showing a difference between Planned and Actual Runtime, leading to unplanned downtime. Performance is at 95.71%, with a slight deficit between Planned and Actual Quantity produced. Quality has a 93.03% rate, detailing the Actual and Accepted Quantity, which alludes to the rate of rejected products. The slide rounds off with an OEE of 83.10% and includes a comment on equipment efficiency improvement compared to the previous year.
Graphical Look
- Title "Production OEE Dashboard" in large, bold, dark blue font against a white background.
- A light blue subtitle text provides context on the slide's data representations.
- Color-coded boxes in orange, blue, and purple display the key areas: Availability, Performance, and Quality, with significant percentage figures in white.
- Bar charts under these percentage figures show Planned vs. Actual data, color intensity varies to differentiate the data.
- A large, pale blue side panel features the OEE percentage prominently displayed.
- A directional arrow in the sidebar points toward two lines of text, offering insight into the equipment's operation.
- An icon of gears is placed in the bottom right, representing the industrial setting.
The slide uses color-coded sections to differentiate and emphasize important data points. The design is clear and structured, enabling ease of interpretation of complex metrics through the use of visual elements such as bar charts and contrasting colors.
Use Cases
- Presenting manufacturing efficiency during executive briefings or strategic meetings.
- Sharing productivity statistics with shareholders or during investor relations updates.
- Employing visual aids for internal reviews with operations or production departments.
- Using as a benchmarking tool in continuous improvement or lean manufacturing initiatives.
How to Edit
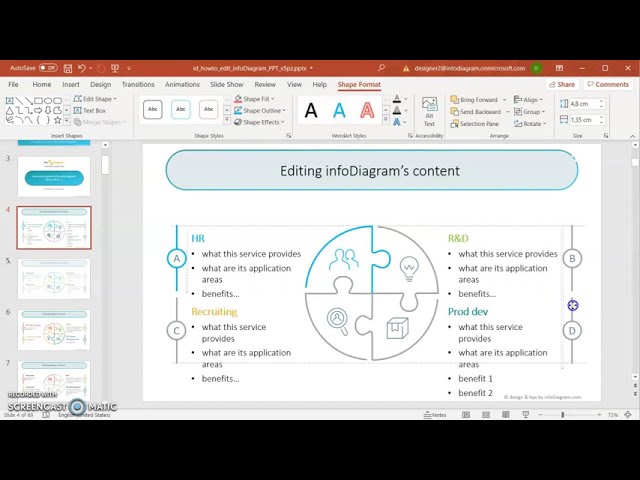
How to edit text & colors

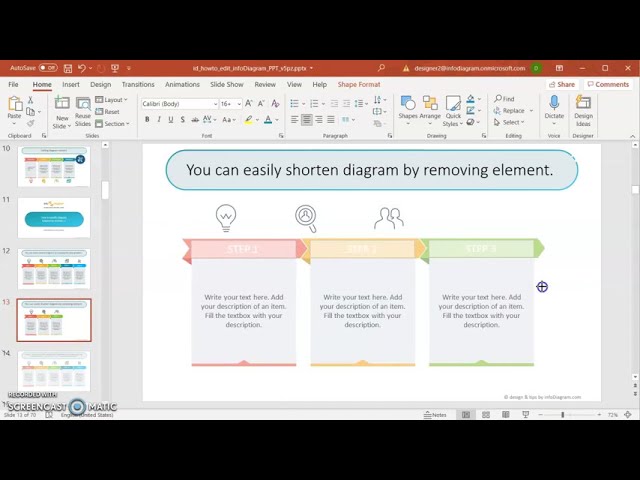
How to expand / shorten diagram

How to Replace Icons in infoDiagram PPT


