Your graphics add a nice touch to my presentations and I recently used them for one of my all-hands meetings. Your toolbox adds professionalism to my slides. Instead of using standard clipart.
Claude Jones, Director of Engineer, @Walmartlabs, USA
Your graphics add a nice touch to my presentations and I recently used them for one of my all-hands meetings. Your toolbox adds professionalism to my slides. Instead of using standard clipart.
Claude Jones, Director of Engineer, @Walmartlabs, USA
I needed a fresh look at some of my slides. I've tried to find a way to create a paintbrush effect, to underline, accentuate, add some color and the handwritten markers were just the things. Very easy to use, easy to size, change the color. It was an affordable, perfect solution and I'm happy to recommend it.
Anonymous, US
The crisp, clean look of the graphics, and the fact that it allowed me to easily edit and change the colors to match the template was my main reason for purchasing them.
Brandie Jenkins, E-learning Developer, USA
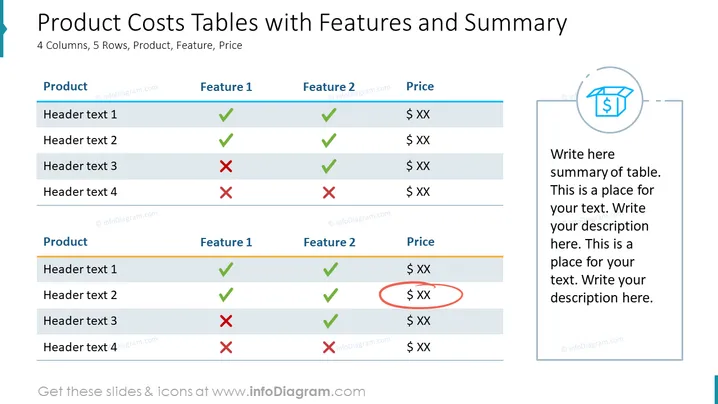
The slide presents two comparison tables highlighting features and prices of different products. Each table has four columns and five rows, designated for Product names, Feature 1, Feature 2, and Price. Green ticks and red crosses are used to represent the presence or absence of the respective features in the product. "Header text 1 to 4" acts as placeholders for product names or descriptions. A special emphasis is placed on a specific price with a red oval highlight. A summary section is reserved on the right, prompting to write a table summary.
The slide uses a clean and professional design with contrasting icons and placeholder texts that visually segment information for clarity. The use of color highlights and different shapes succinctly conveys the status of features across products.


