Your graphics add a nice touch to my presentations and I recently used them for one of my all-hands meetings. Your toolbox adds professionalism to my slides. Instead of using standard clipart.
Claude Jones, Director of Engineer, @Walmartlabs, USA
Your graphics add a nice touch to my presentations and I recently used them for one of my all-hands meetings. Your toolbox adds professionalism to my slides. Instead of using standard clipart.
Claude Jones, Director of Engineer, @Walmartlabs, USA
I needed a fresh look at some of my slides. I've tried to find a way to create a paintbrush effect, to underline, accentuate, add some color and the handwritten markers were just the things. Very easy to use, easy to size, change the color. It was an affordable, perfect solution and I'm happy to recommend it.
Anonymous, US
The crisp, clean look of the graphics, and the fact that it allowed me to easily edit and change the colors to match the template was my main reason for purchasing them.
Brandie Jenkins, E-learning Developer, USA
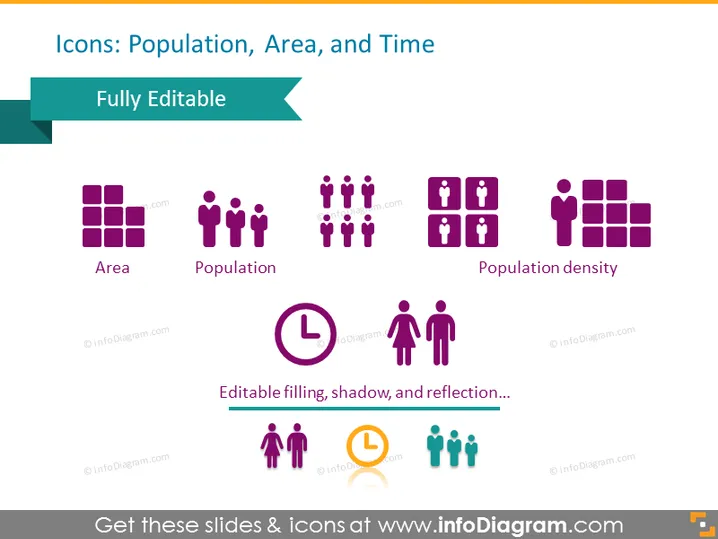
This PowerPoint slide is designed to present icons associated with the concepts of population, area, and time. "Area" is symbolized with a grid, indicating a sectioned space or a location. "Population" is represented by a group of figures, reflecting the number of individuals within a population. "Population density" is depicted with a packed group of figures next to a grid, illustrating the ratio of people to space. An editable clock icon highlights the aspect of time, suggesting a temporal measurement or duration. The slide emphasizes that these icons are fully editable, allowing customization such as filling, shadow effects, and reflection.
The overall visual composition of the slide is professional and uncluttered with a harmonious color scheme of purples and teals complementing the white background. The icons are simple yet descriptive, conveying their respective concepts effectively.


